 grafana绘图使用插件或表盘等资料收集整理
文章发布较早,内容可能过时,阅读注意甄别。
# 1,插件
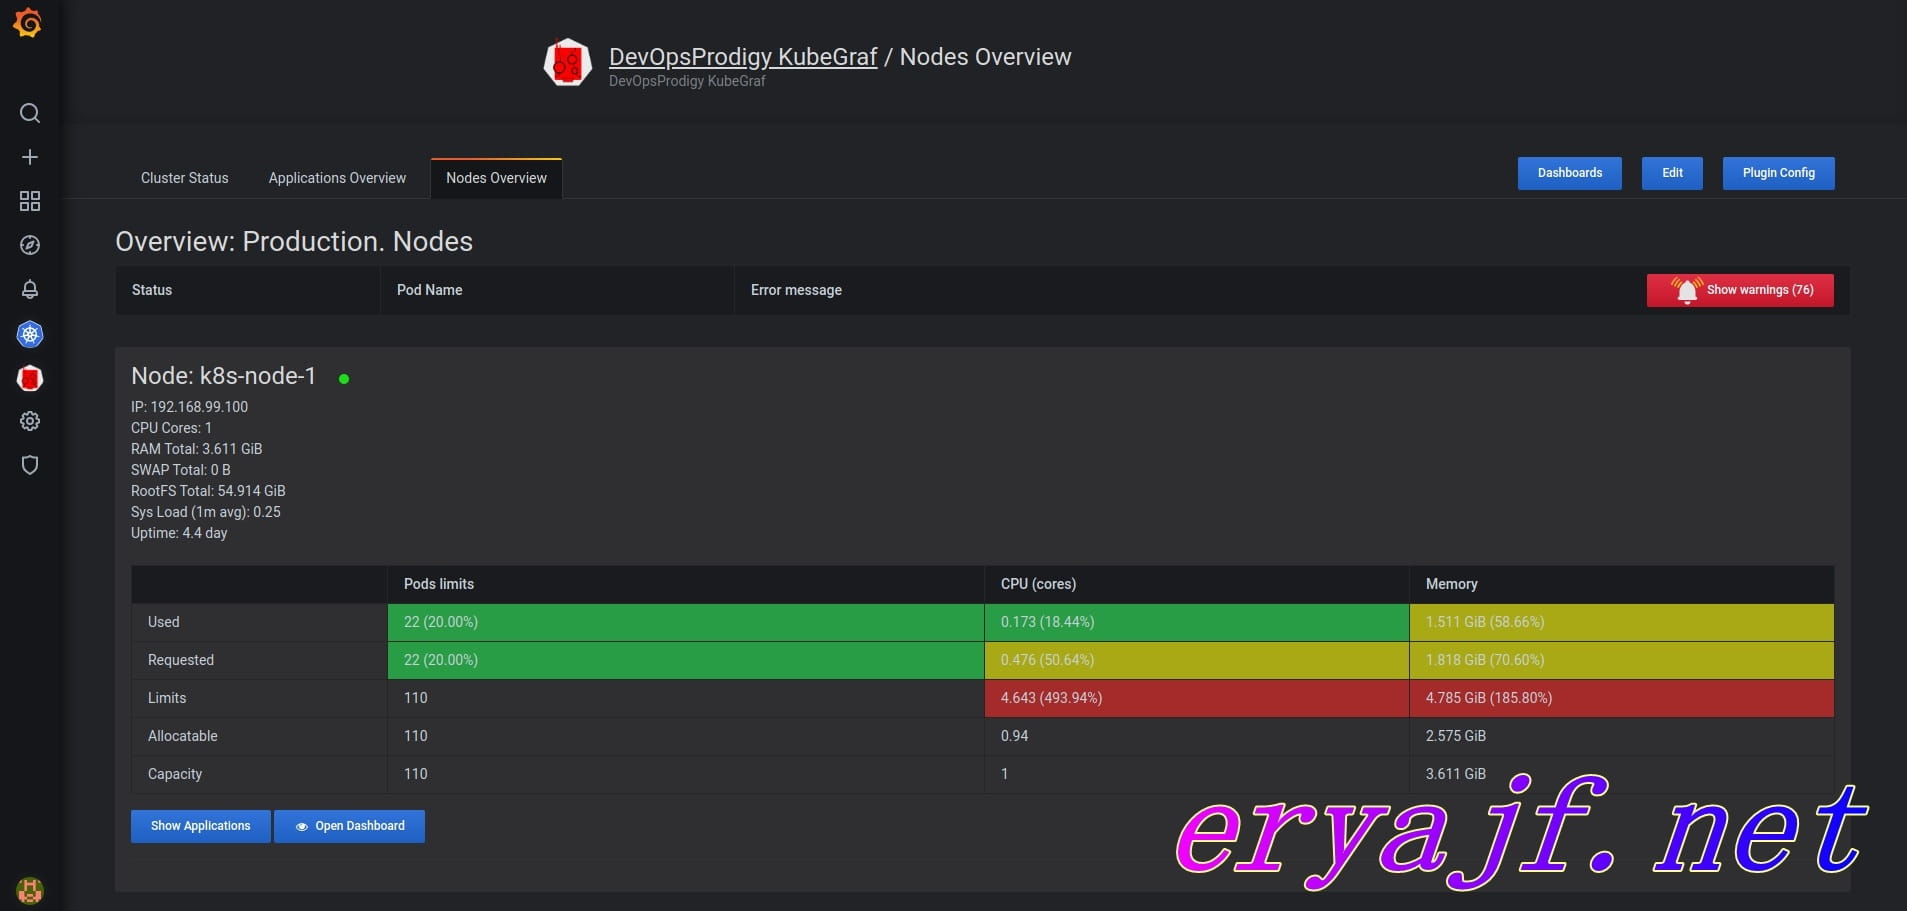
# 1,k8s 集群状态监控插件 (opens new window)
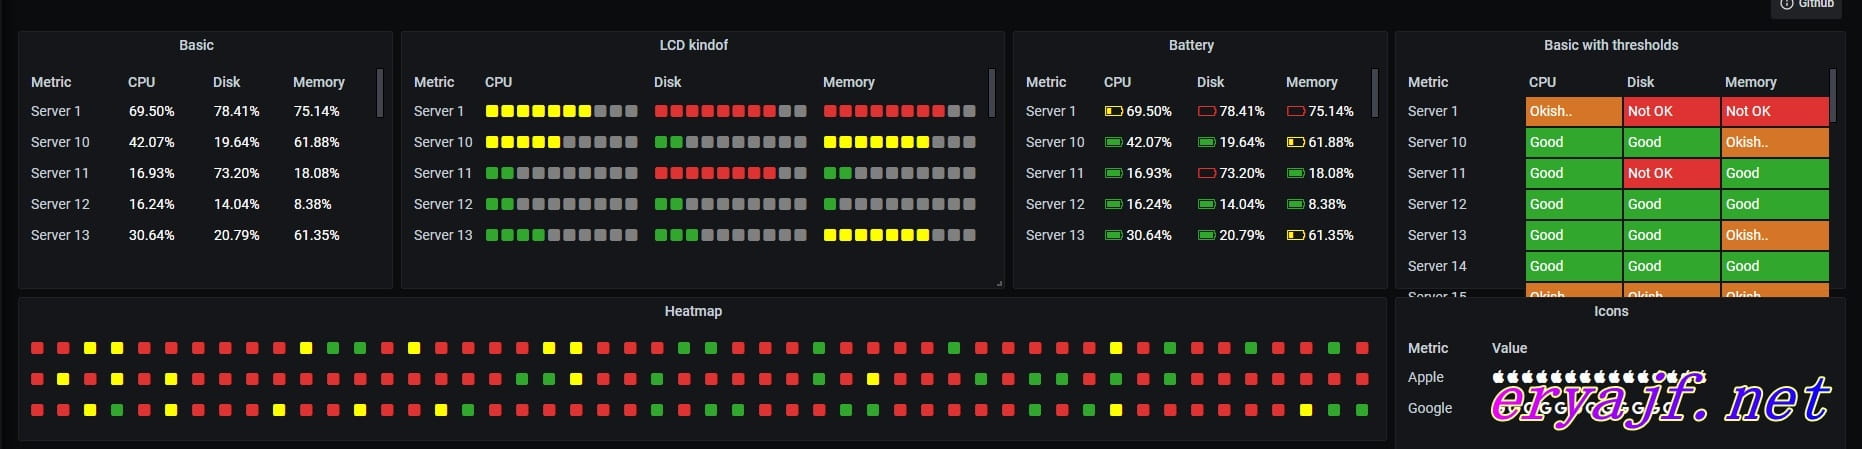
# 2,散点表格监控 (opens new window)
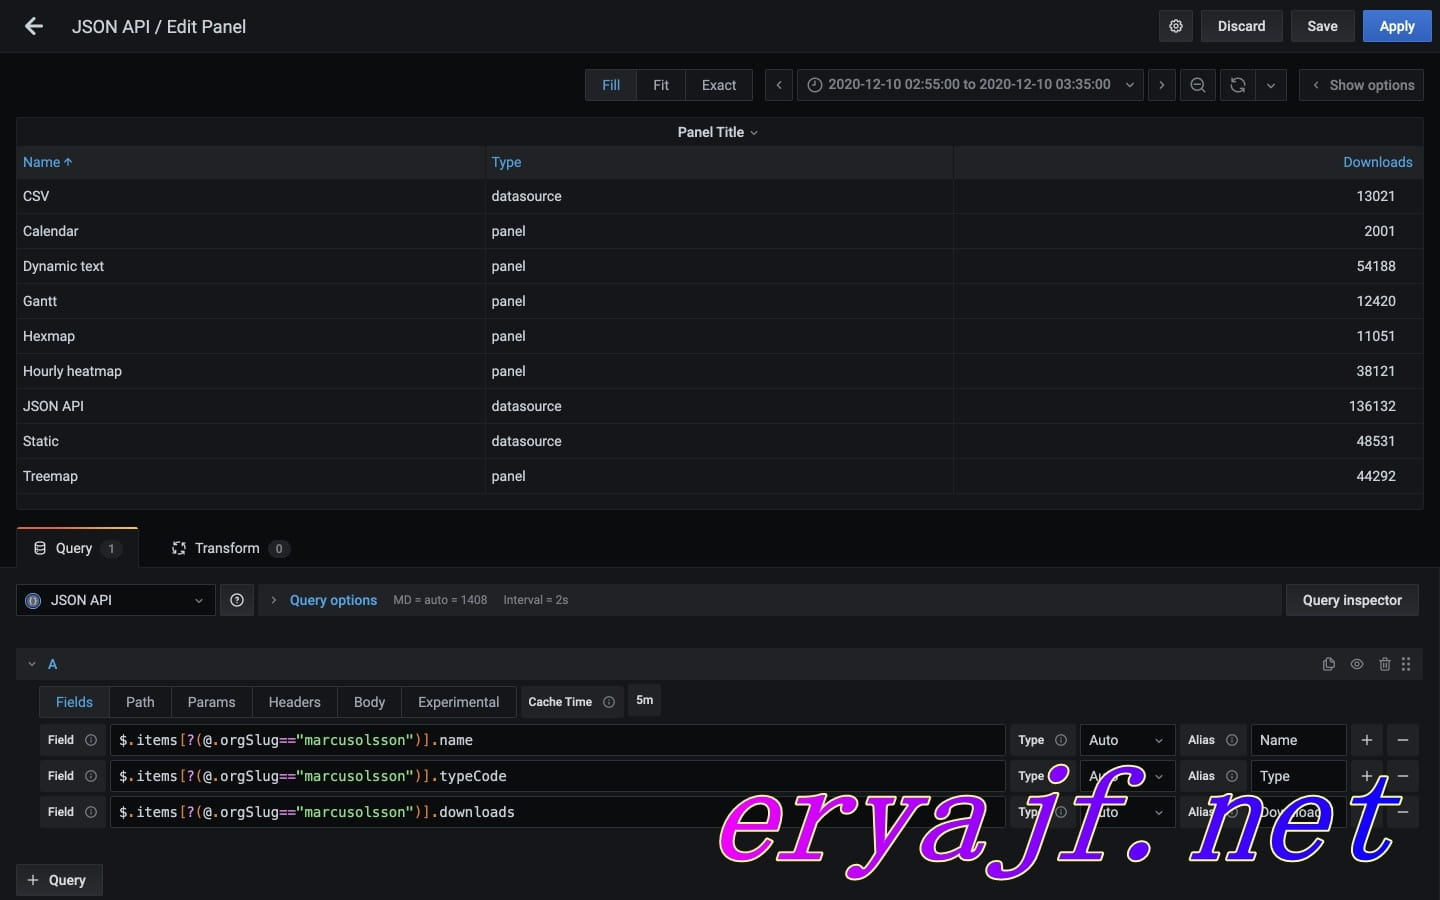
# 3,一个从接口返回 json 数据的图表 (opens new window)
# 4,Grafana 数据源插件可从 JSON,CSV,XML,GraphQL 和 HTML 获取数据 (opens new window)
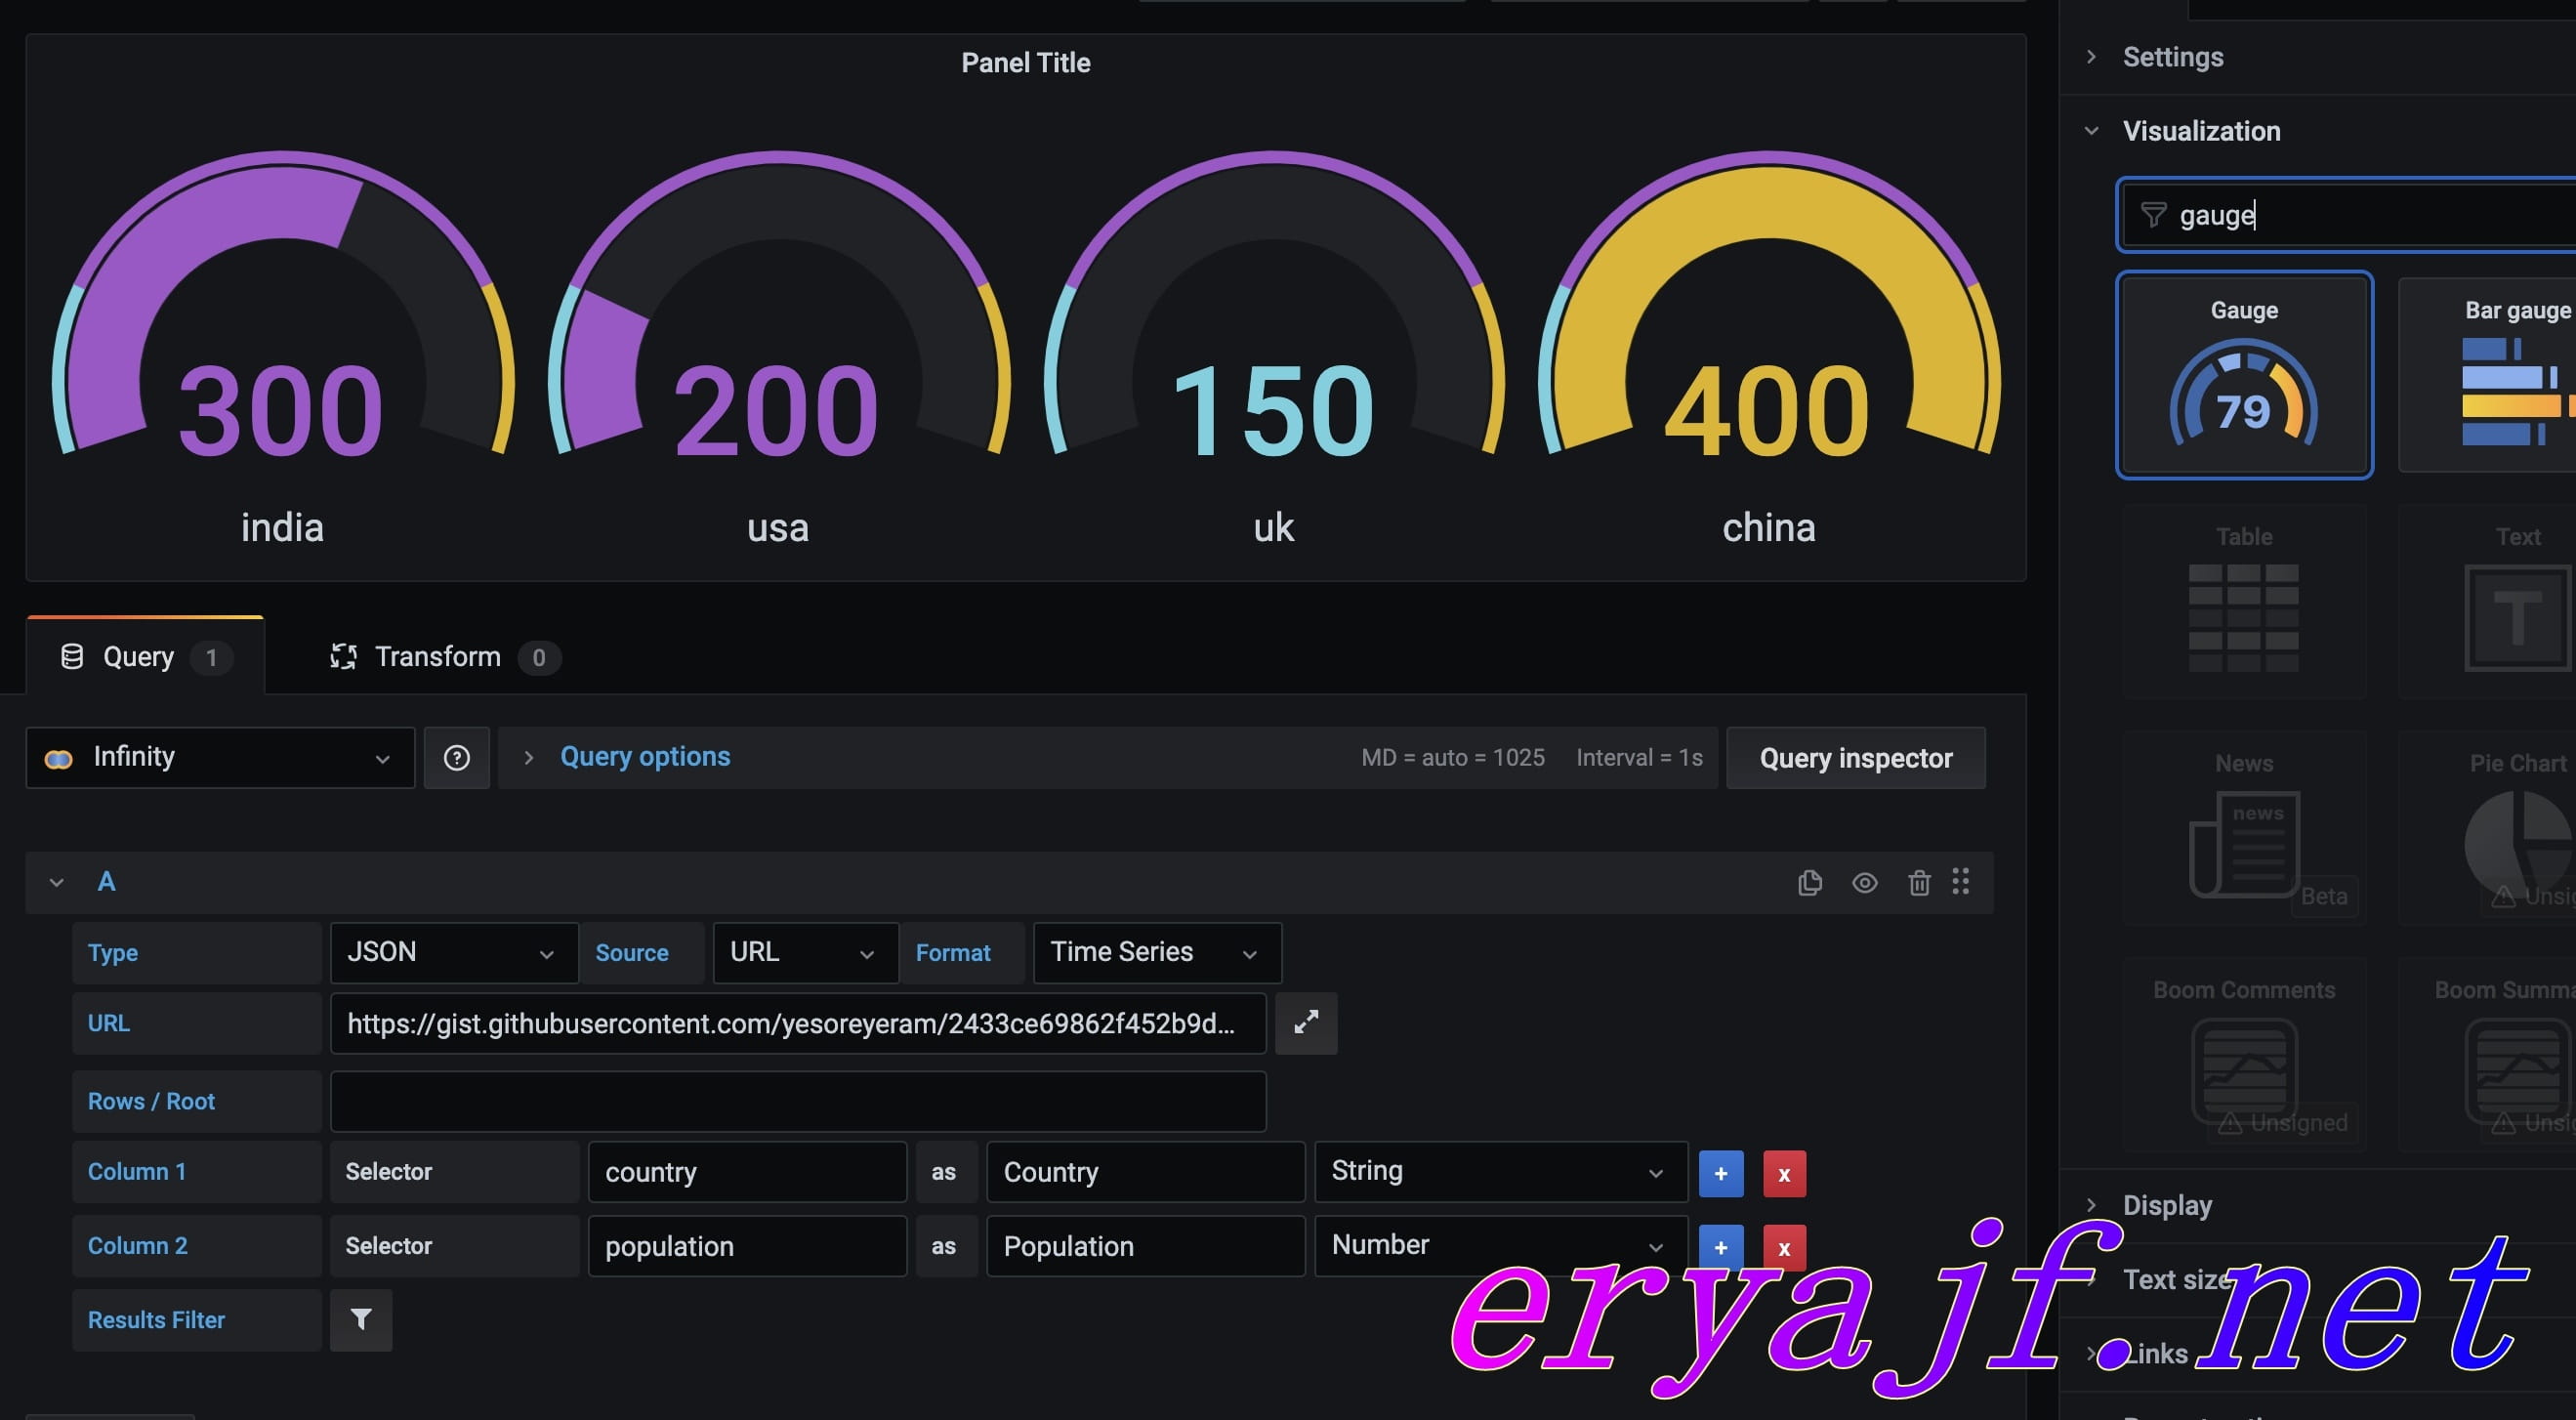
作为参考,下面给出了来自 URL 的 JSON 数据
[
  { “国家”:“印度”,“人口”:300 },
  { “国家”:“美国”,“人口”:200 },
  { “国家”:“英国”,“人口”:150 },
  { “国家”:“中国”,“人口”:400 }
]
1
2
3
4
5
6
2
3
4
5
6
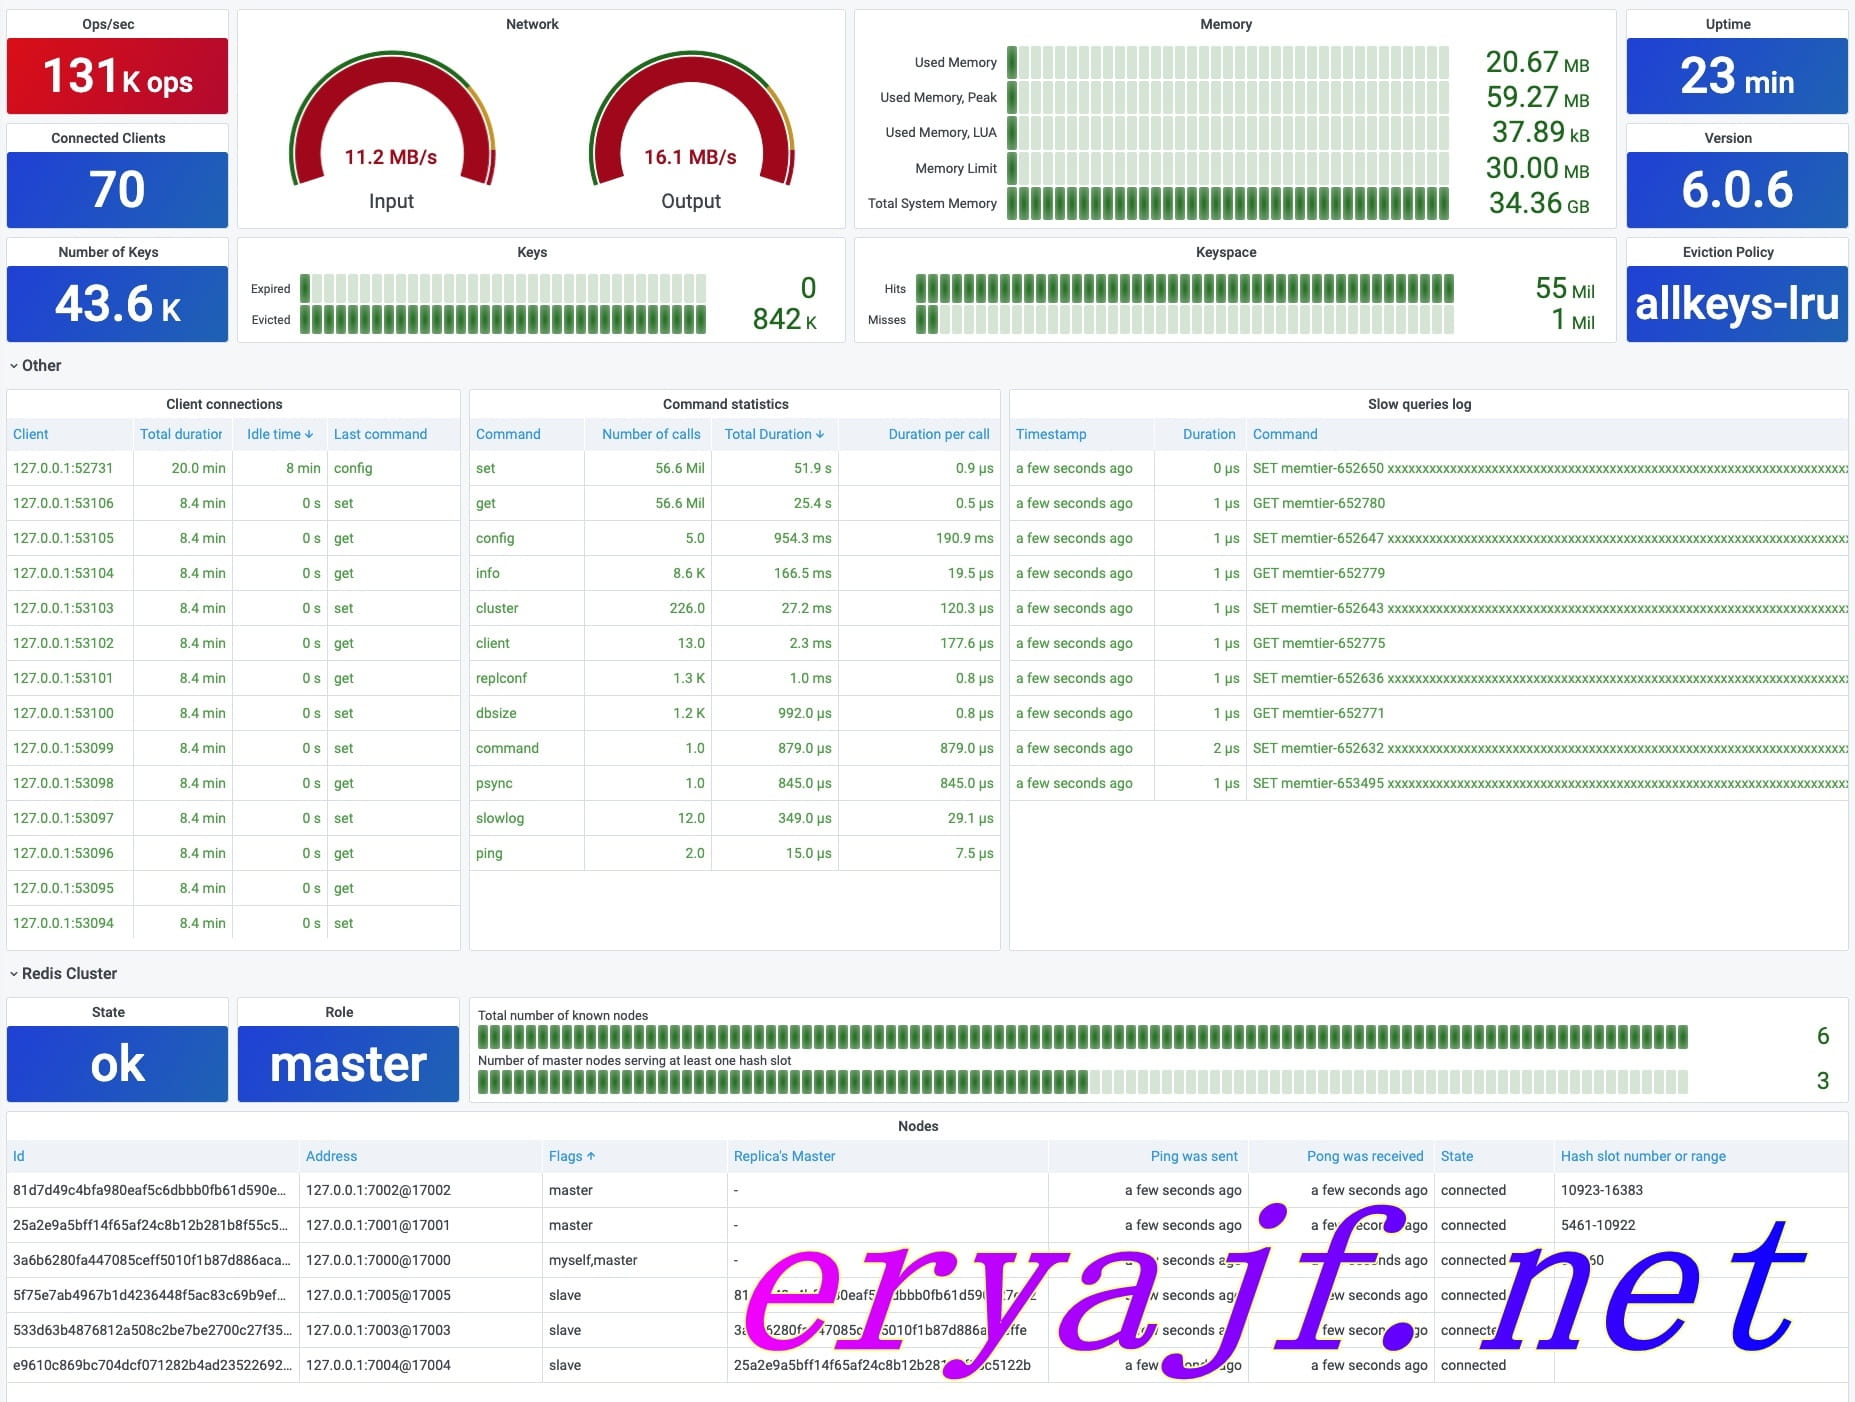
# 5,redis-datasource (opens new window)
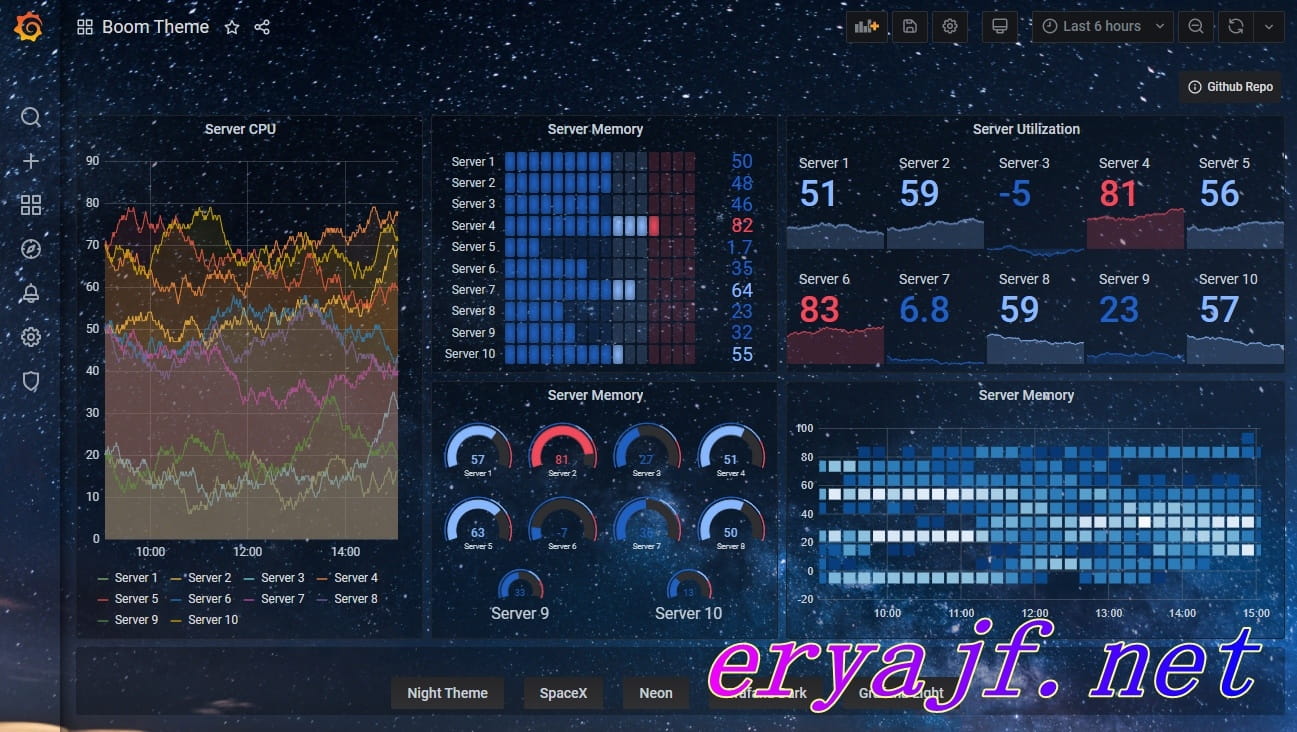
# 6,一个好看的主题 (opens new window)
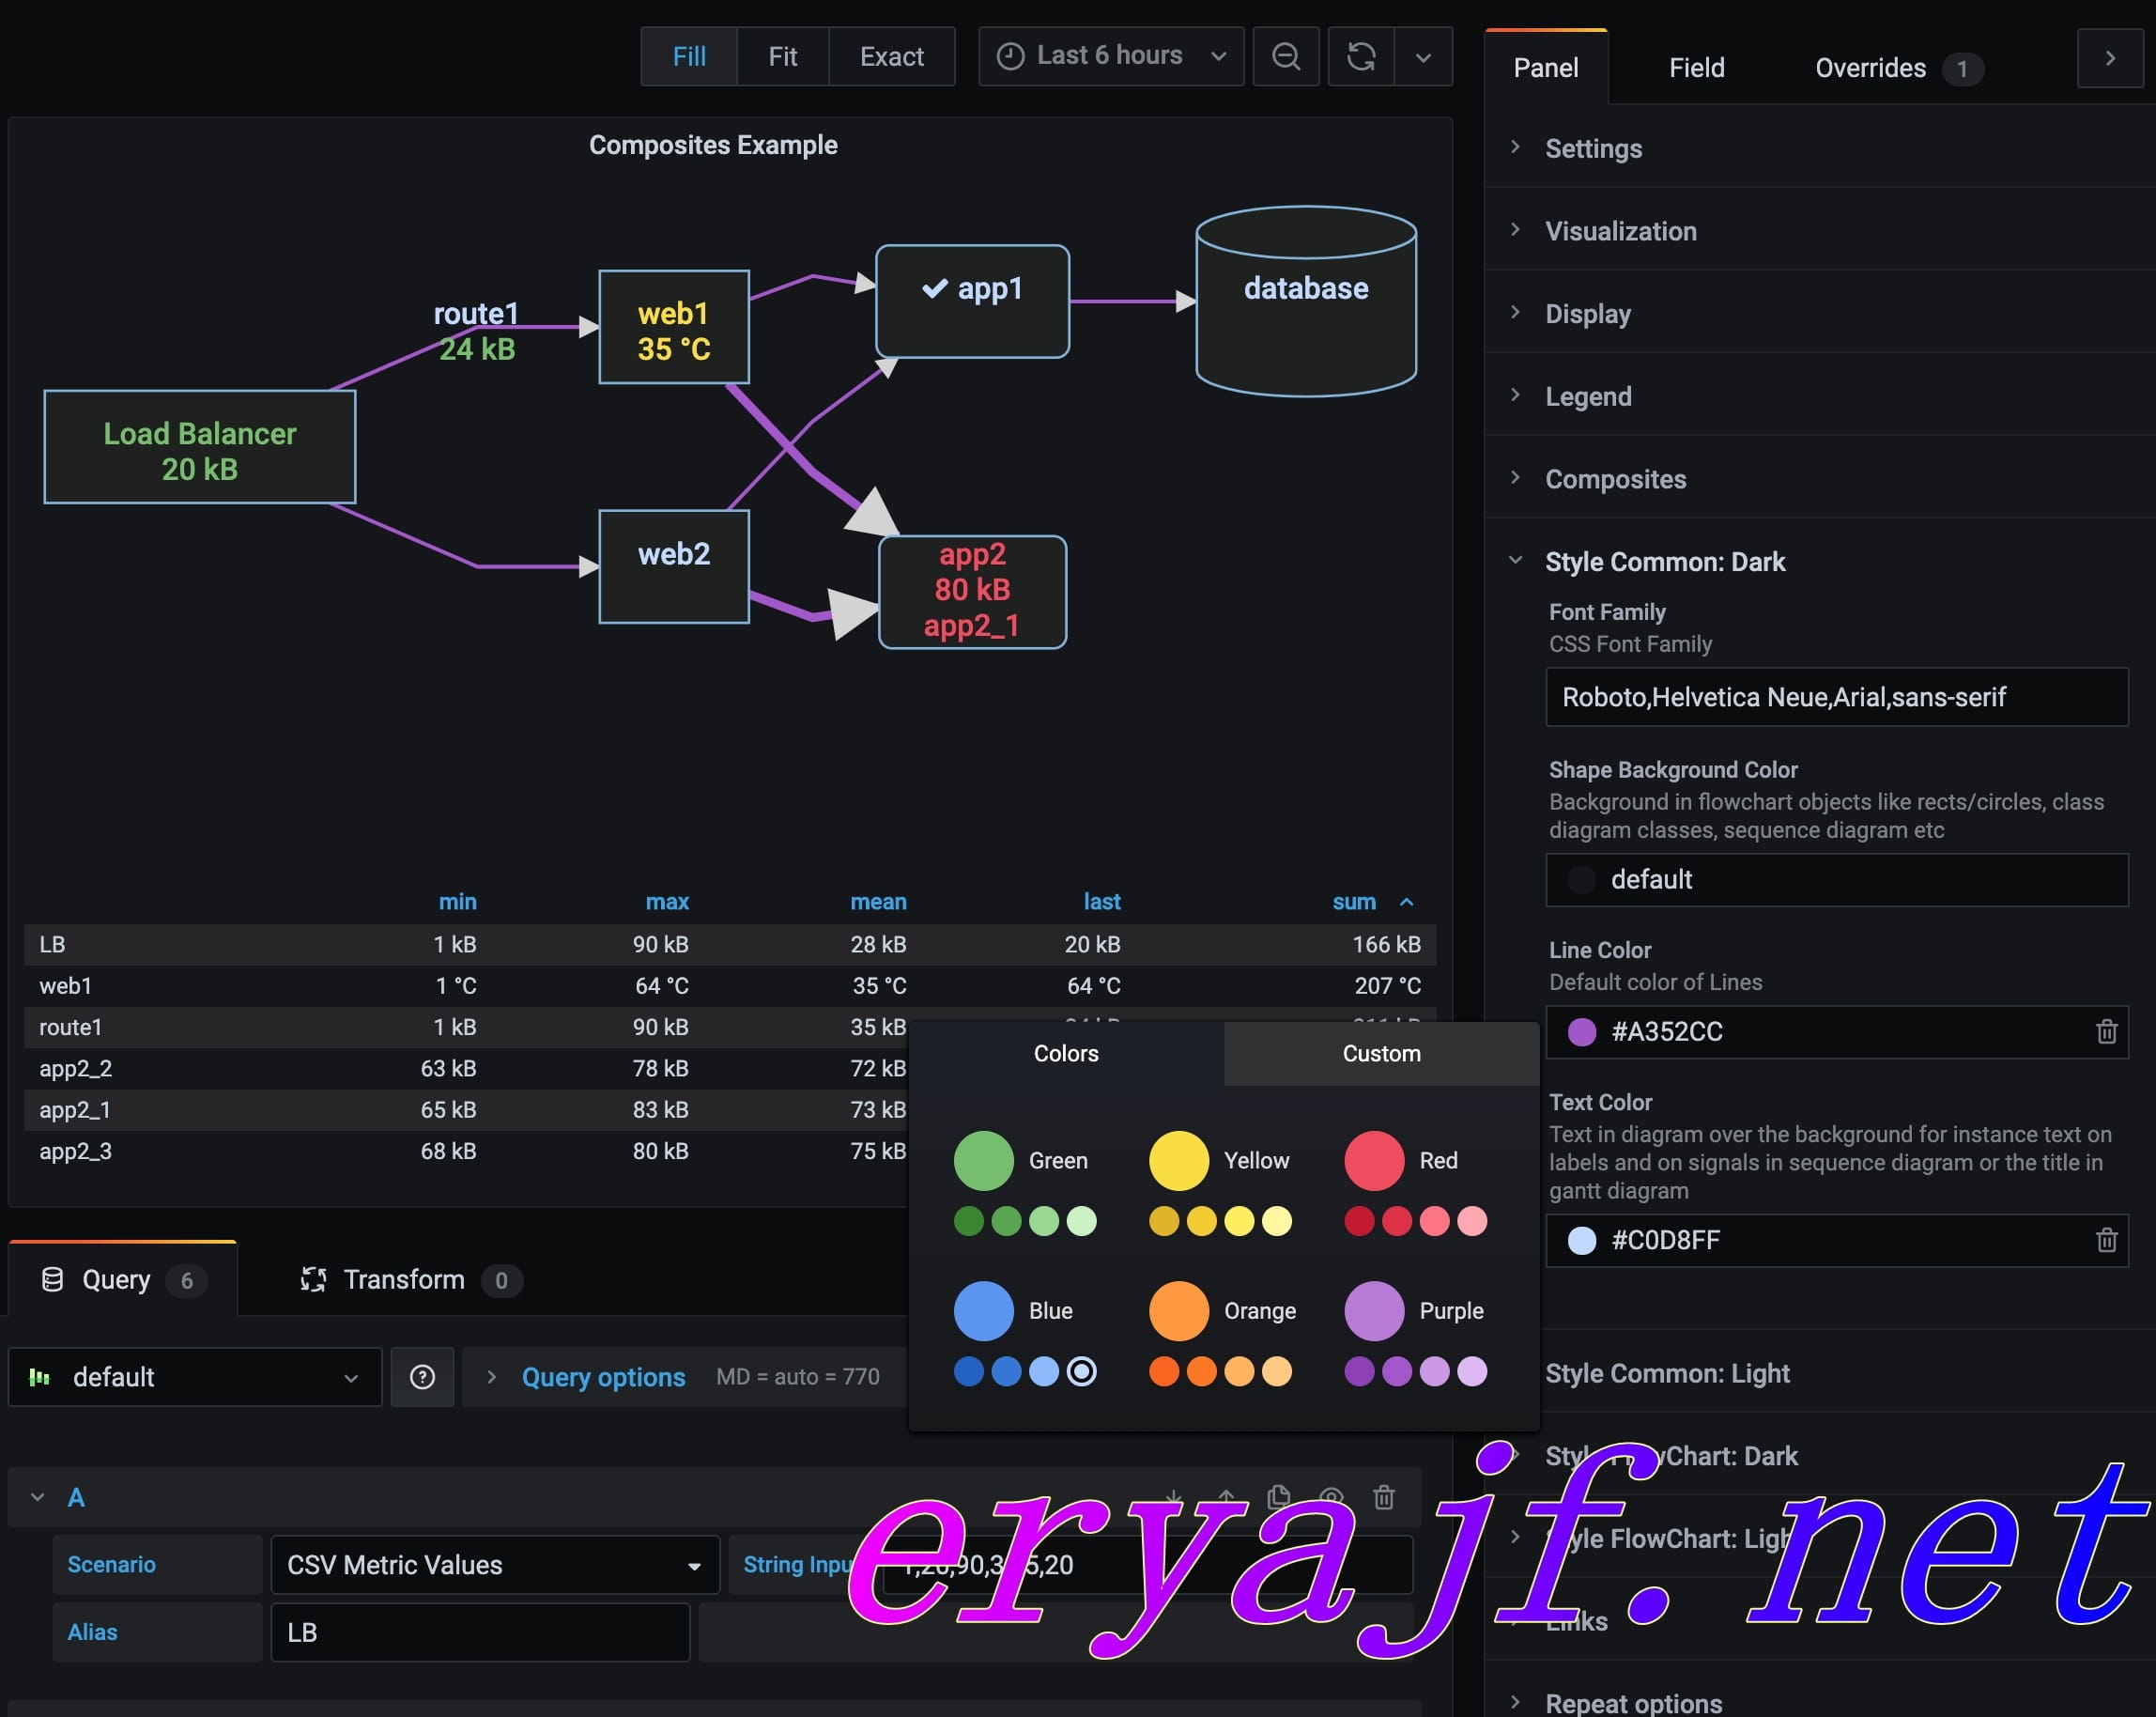
# 7,markdown 流程图 (opens new window)
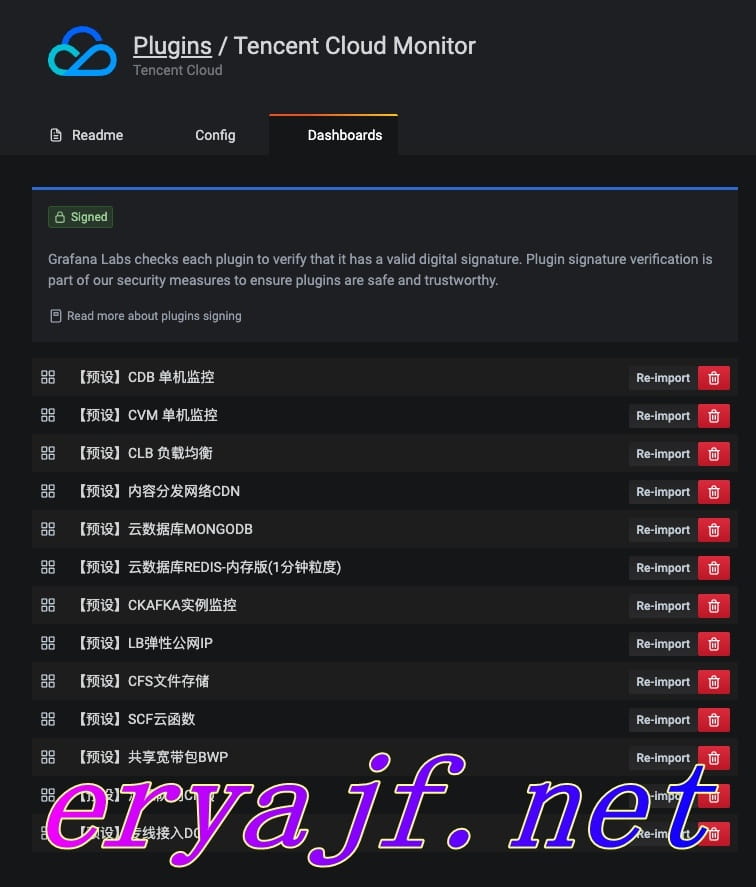
# 8,腾讯云监控插件 (opens new window)
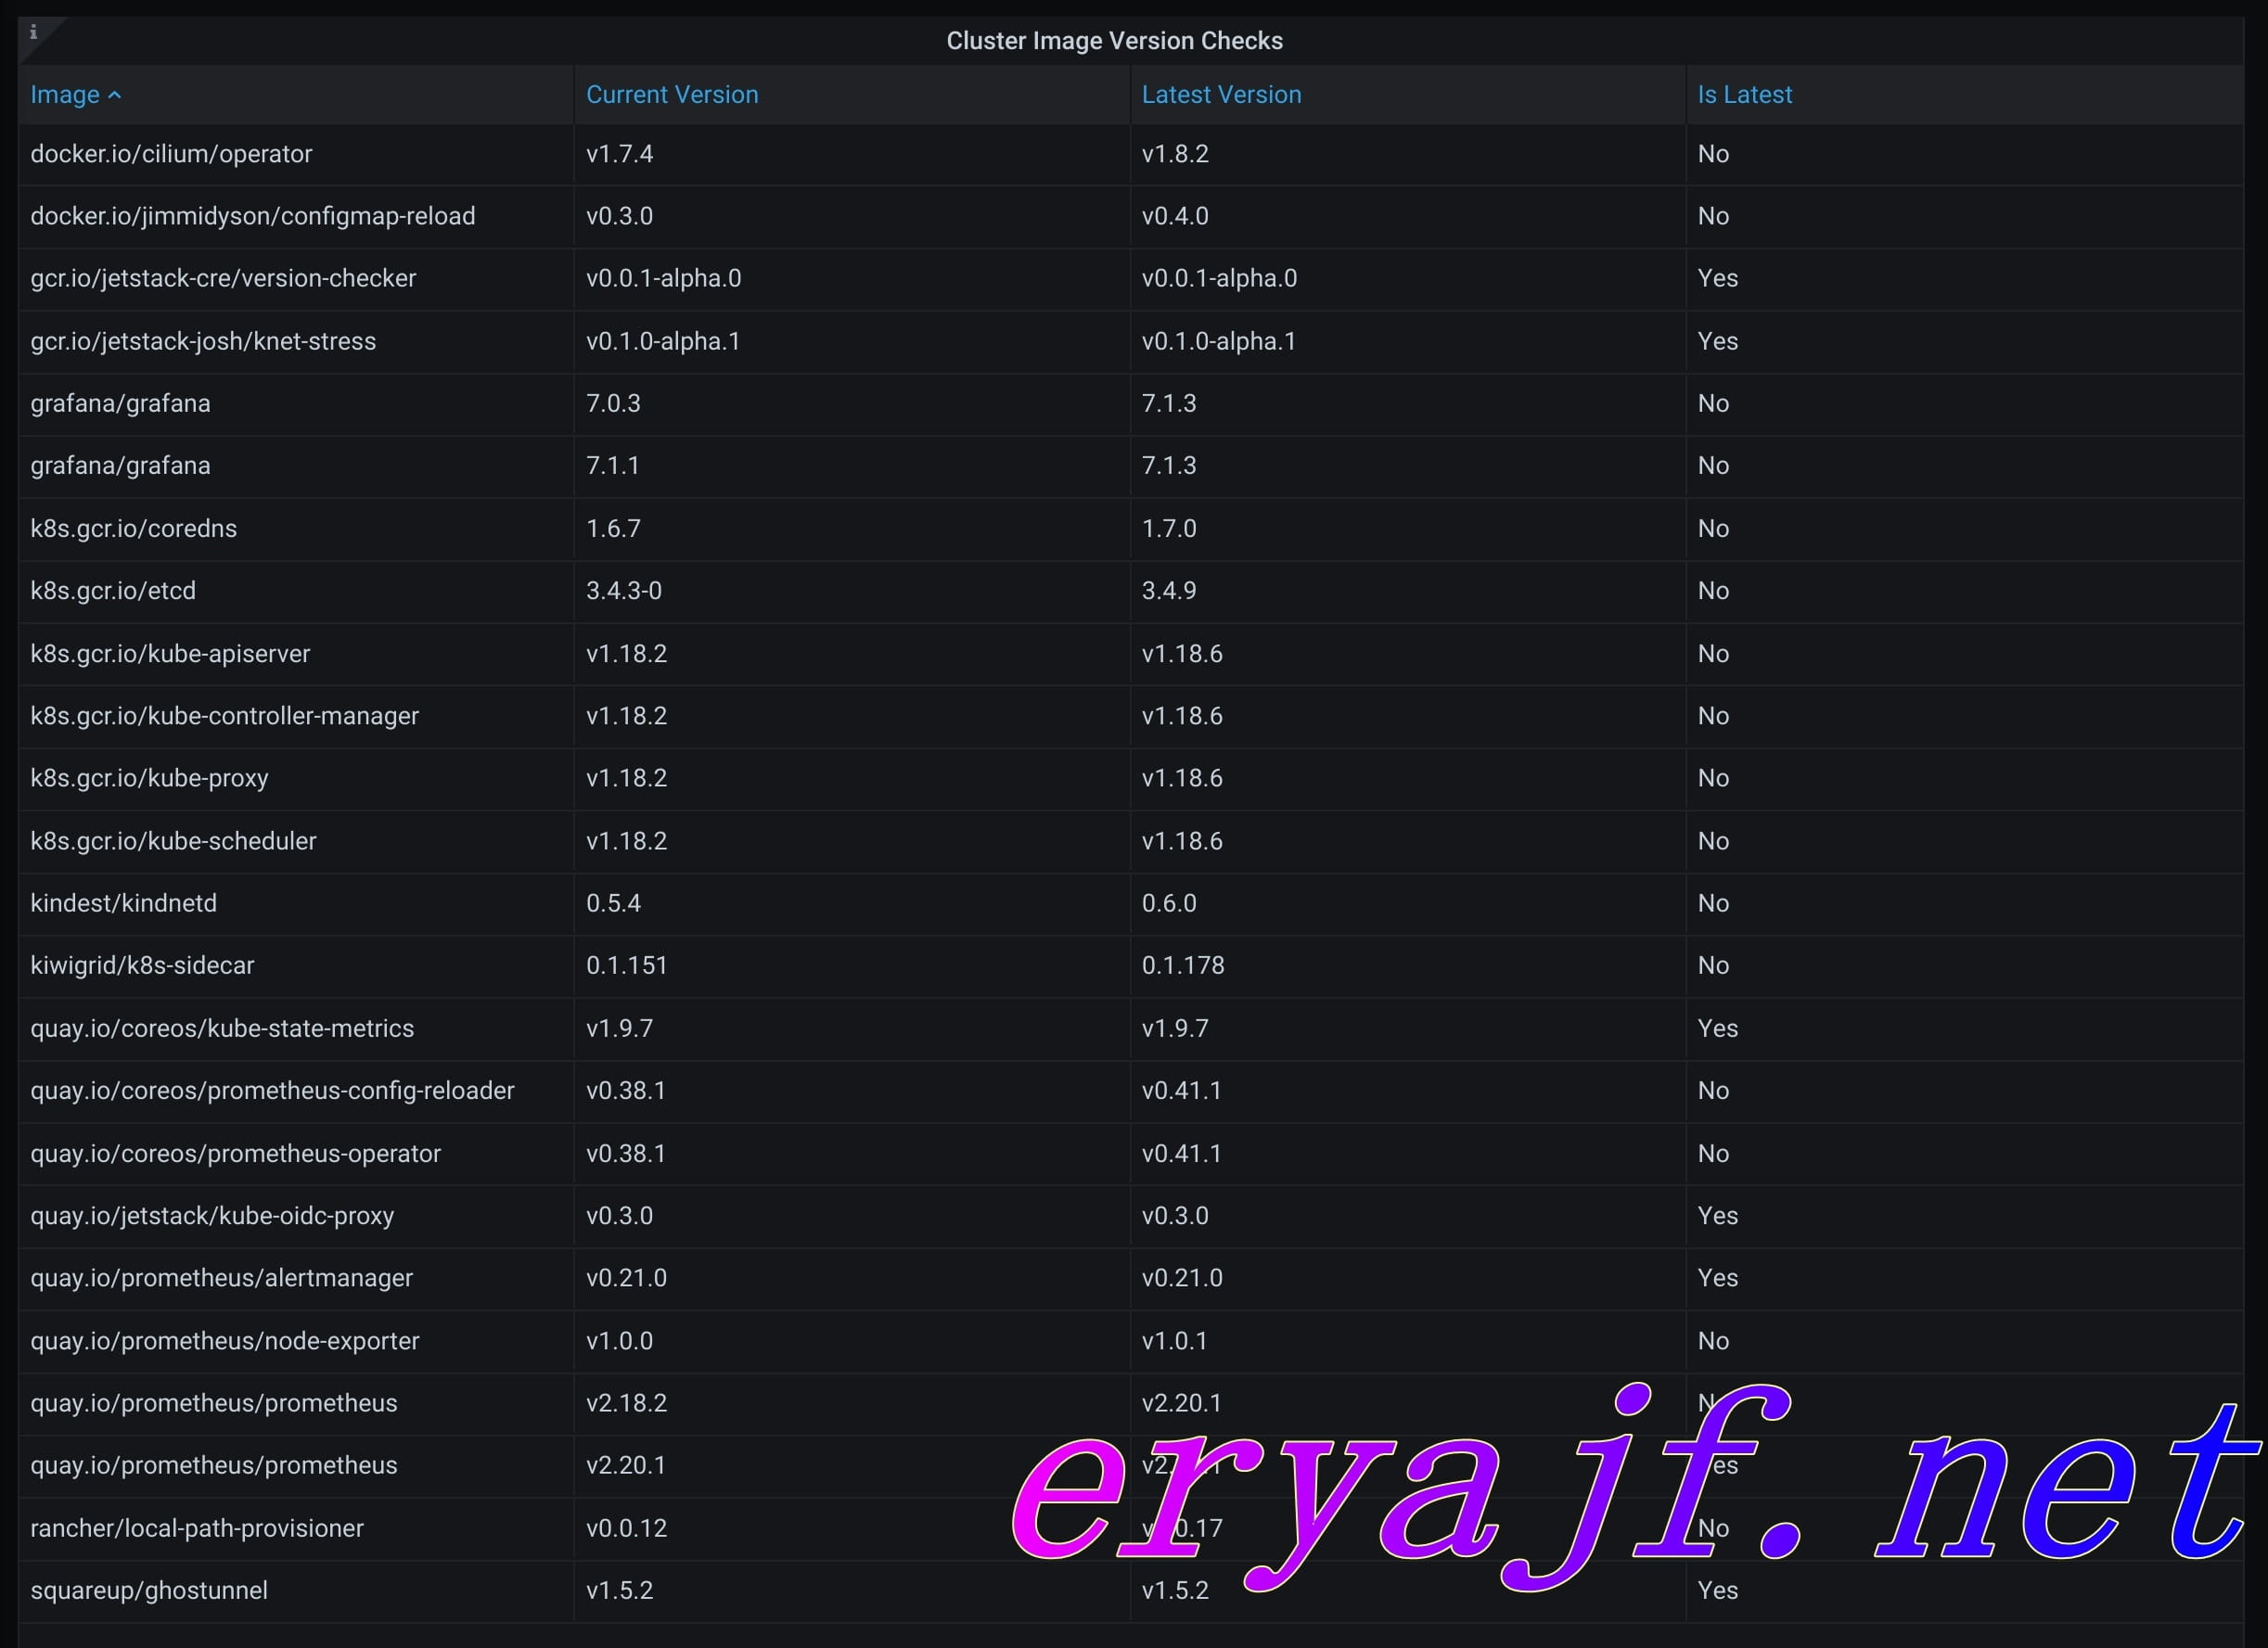
# 9,k8s 镜像版本检查 (opens new window)
只不过不支持内部私服。
# 10,通过接口绘制嵌套内容 (opens new window)
# 2,exporter
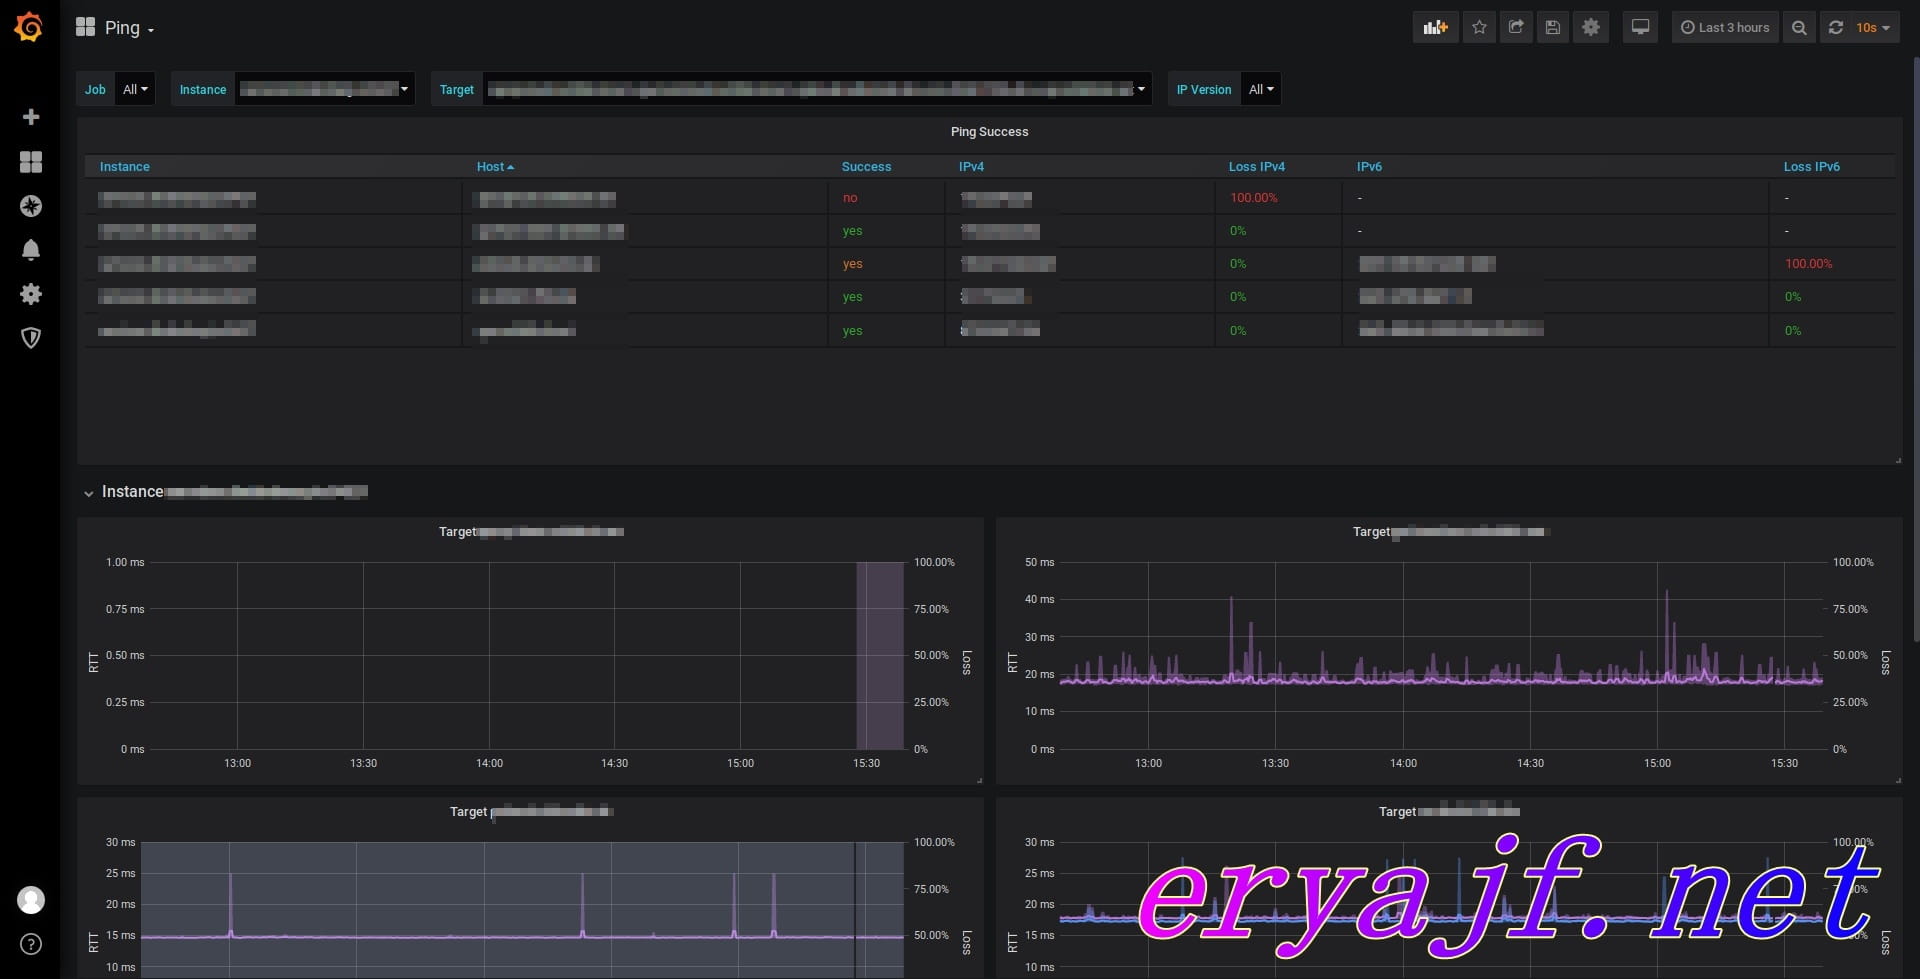
# 1,ping_exporter (opens new window)
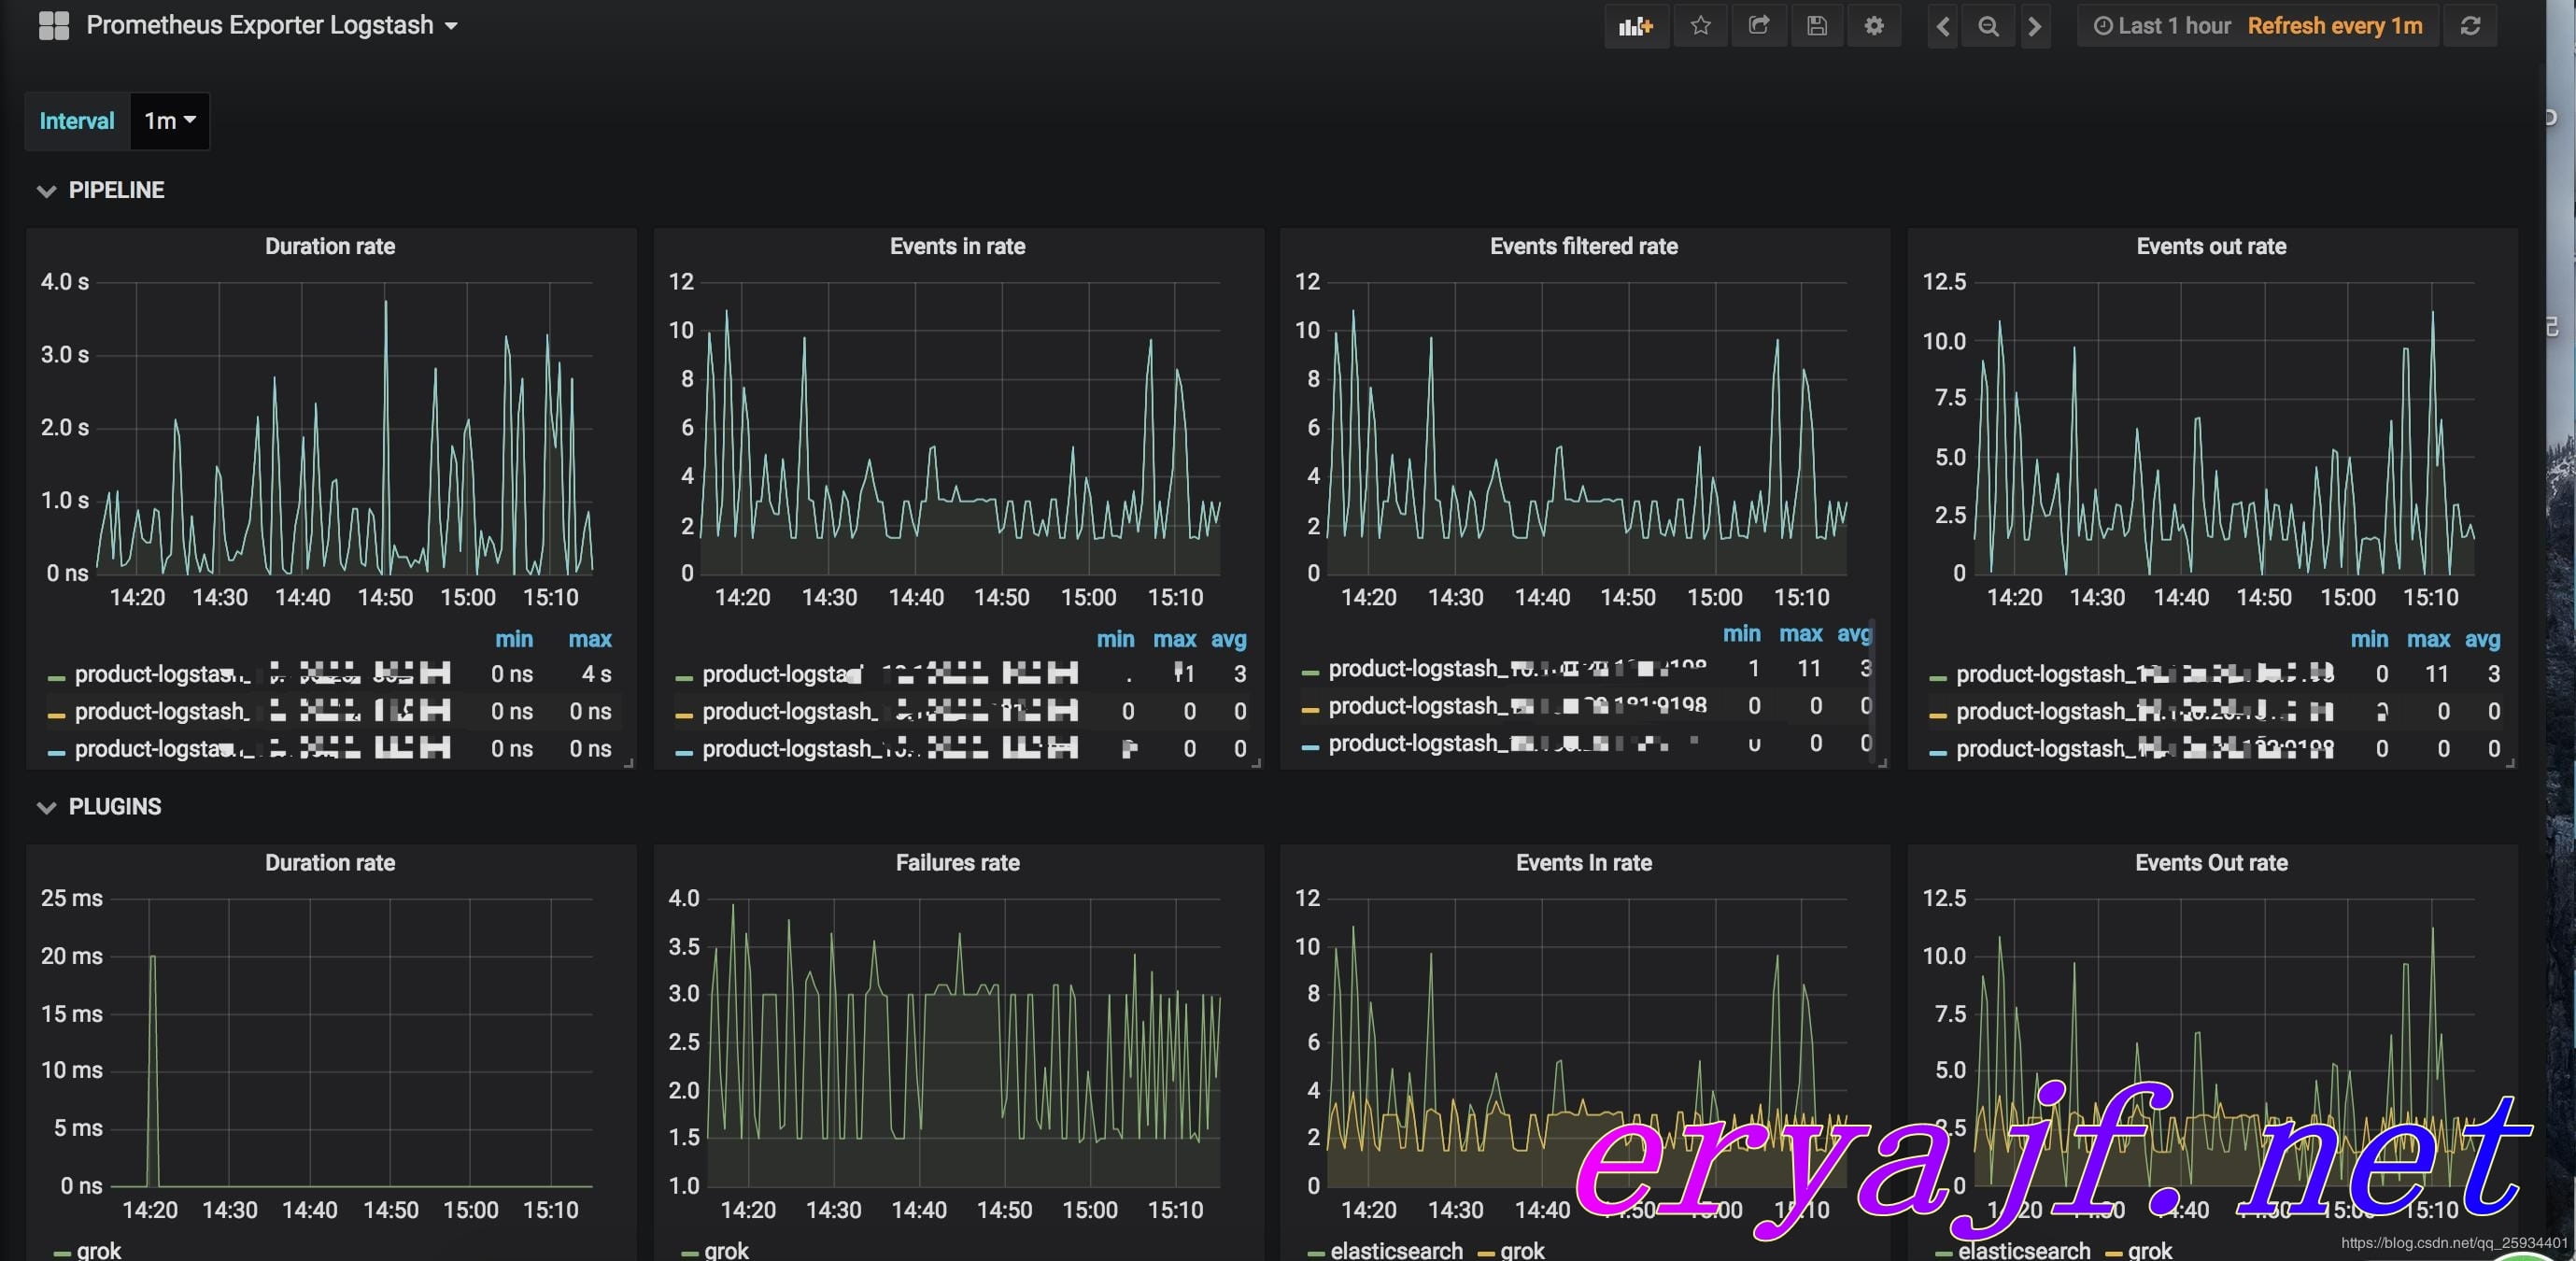
# 2,logstash_exporter (opens new window)
# 3,dashboard
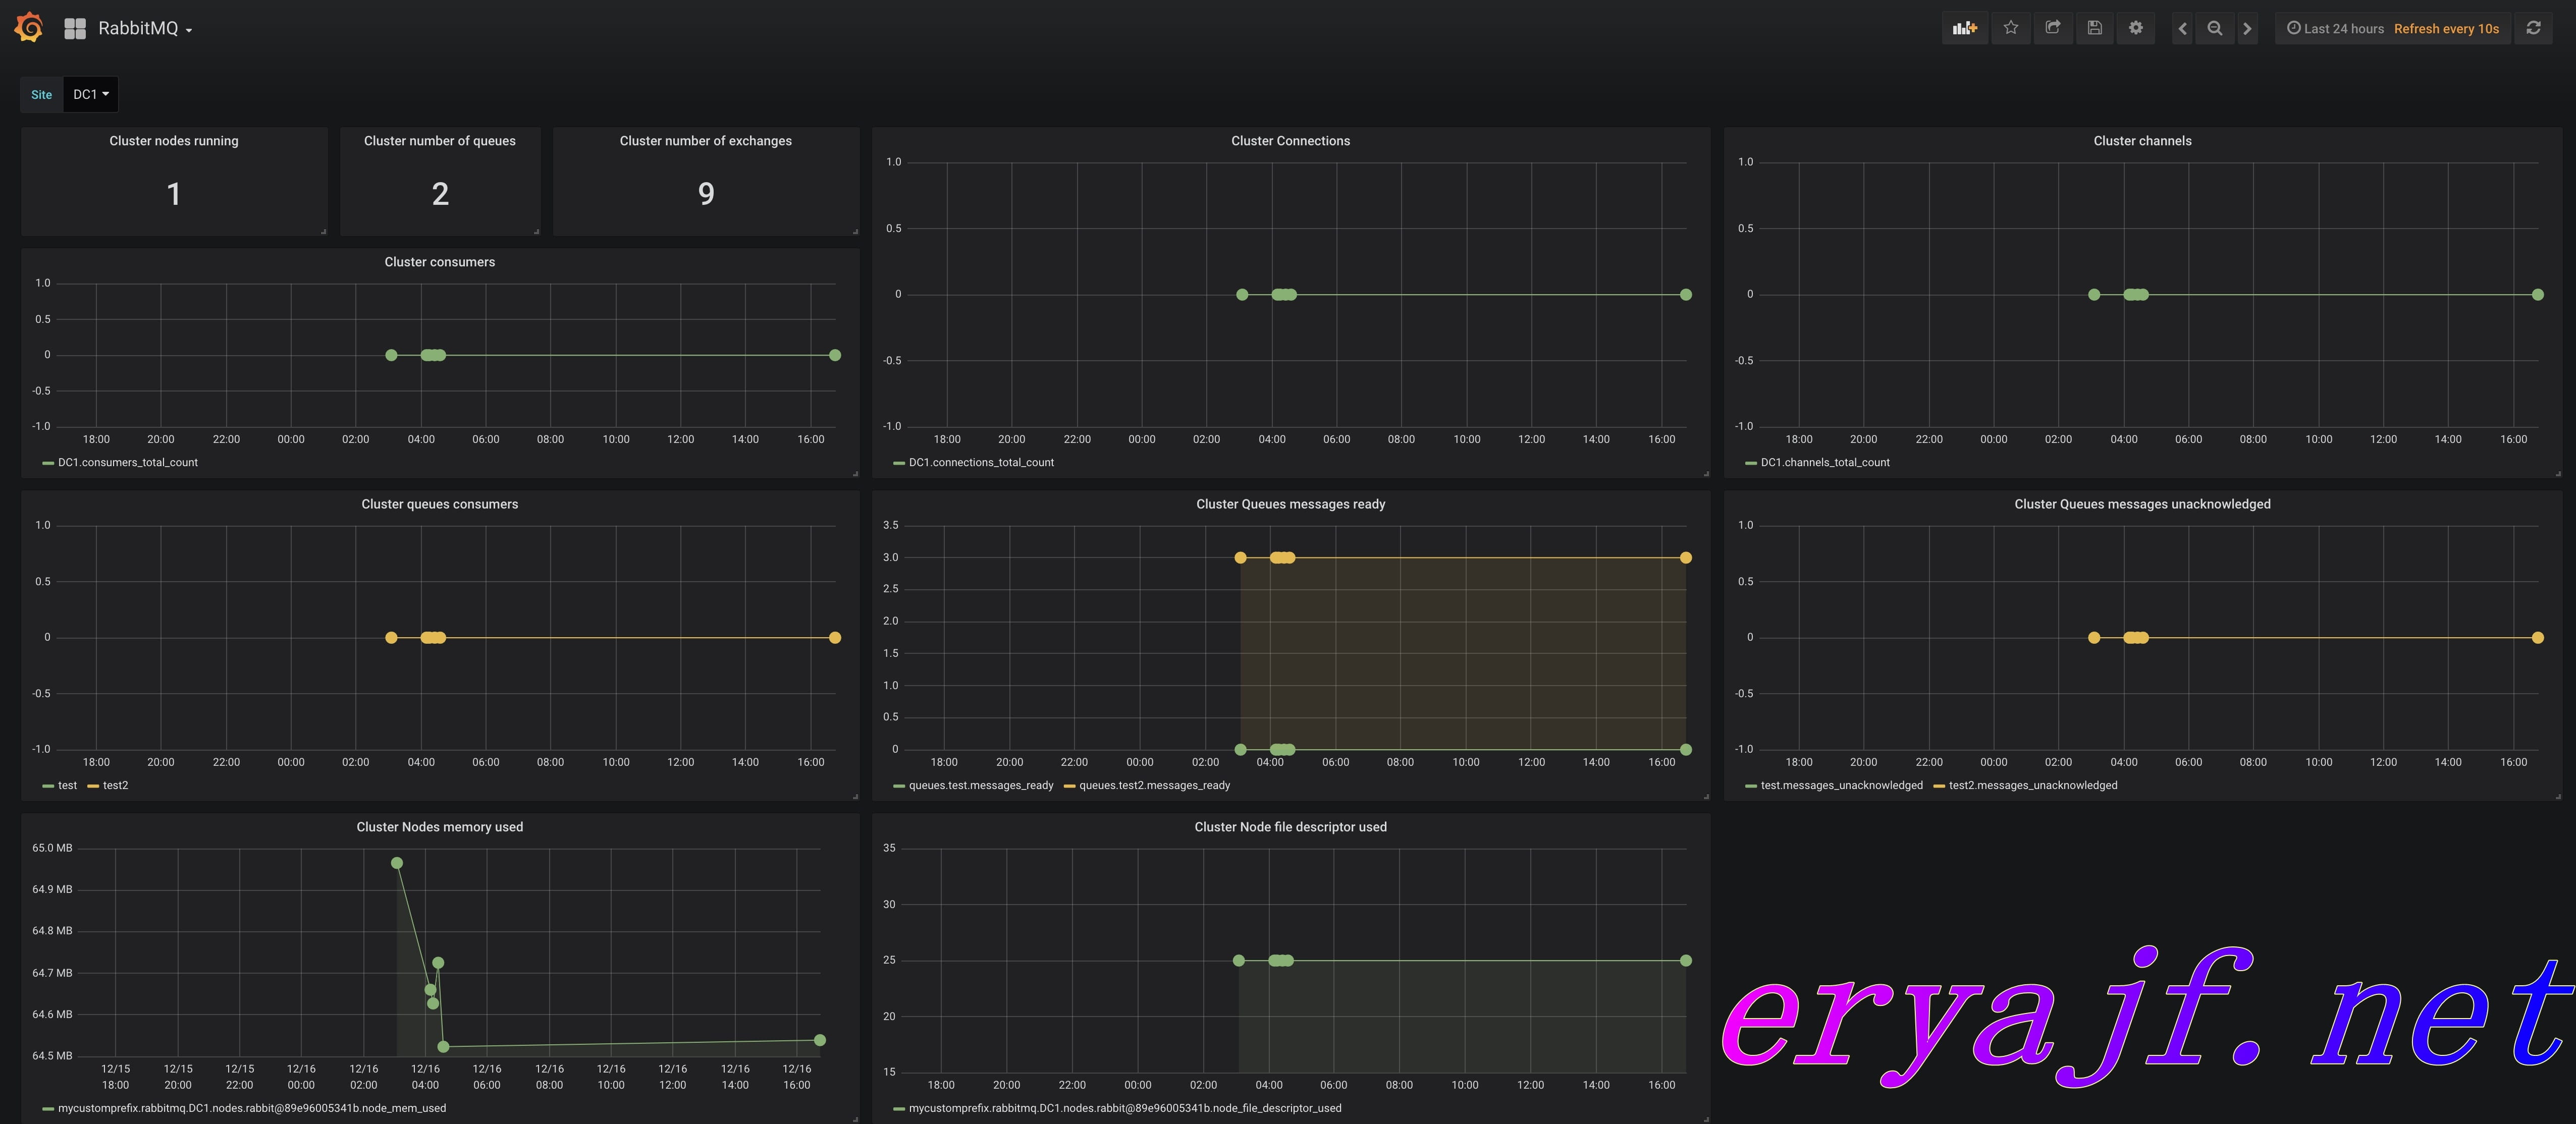
# 1,rabbitmq_dashborard (opens new window)
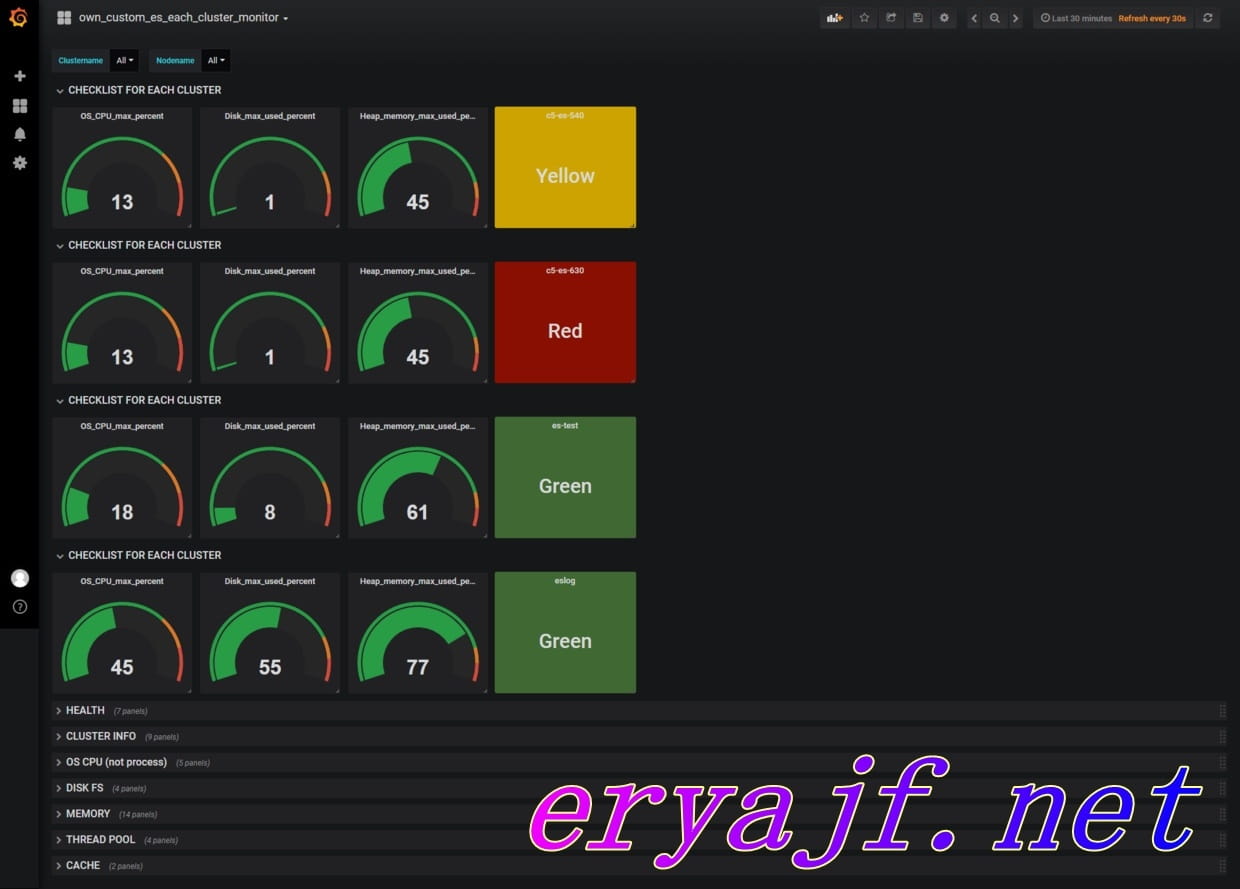
# 2,elasticsearch_dashboard (opens new window)
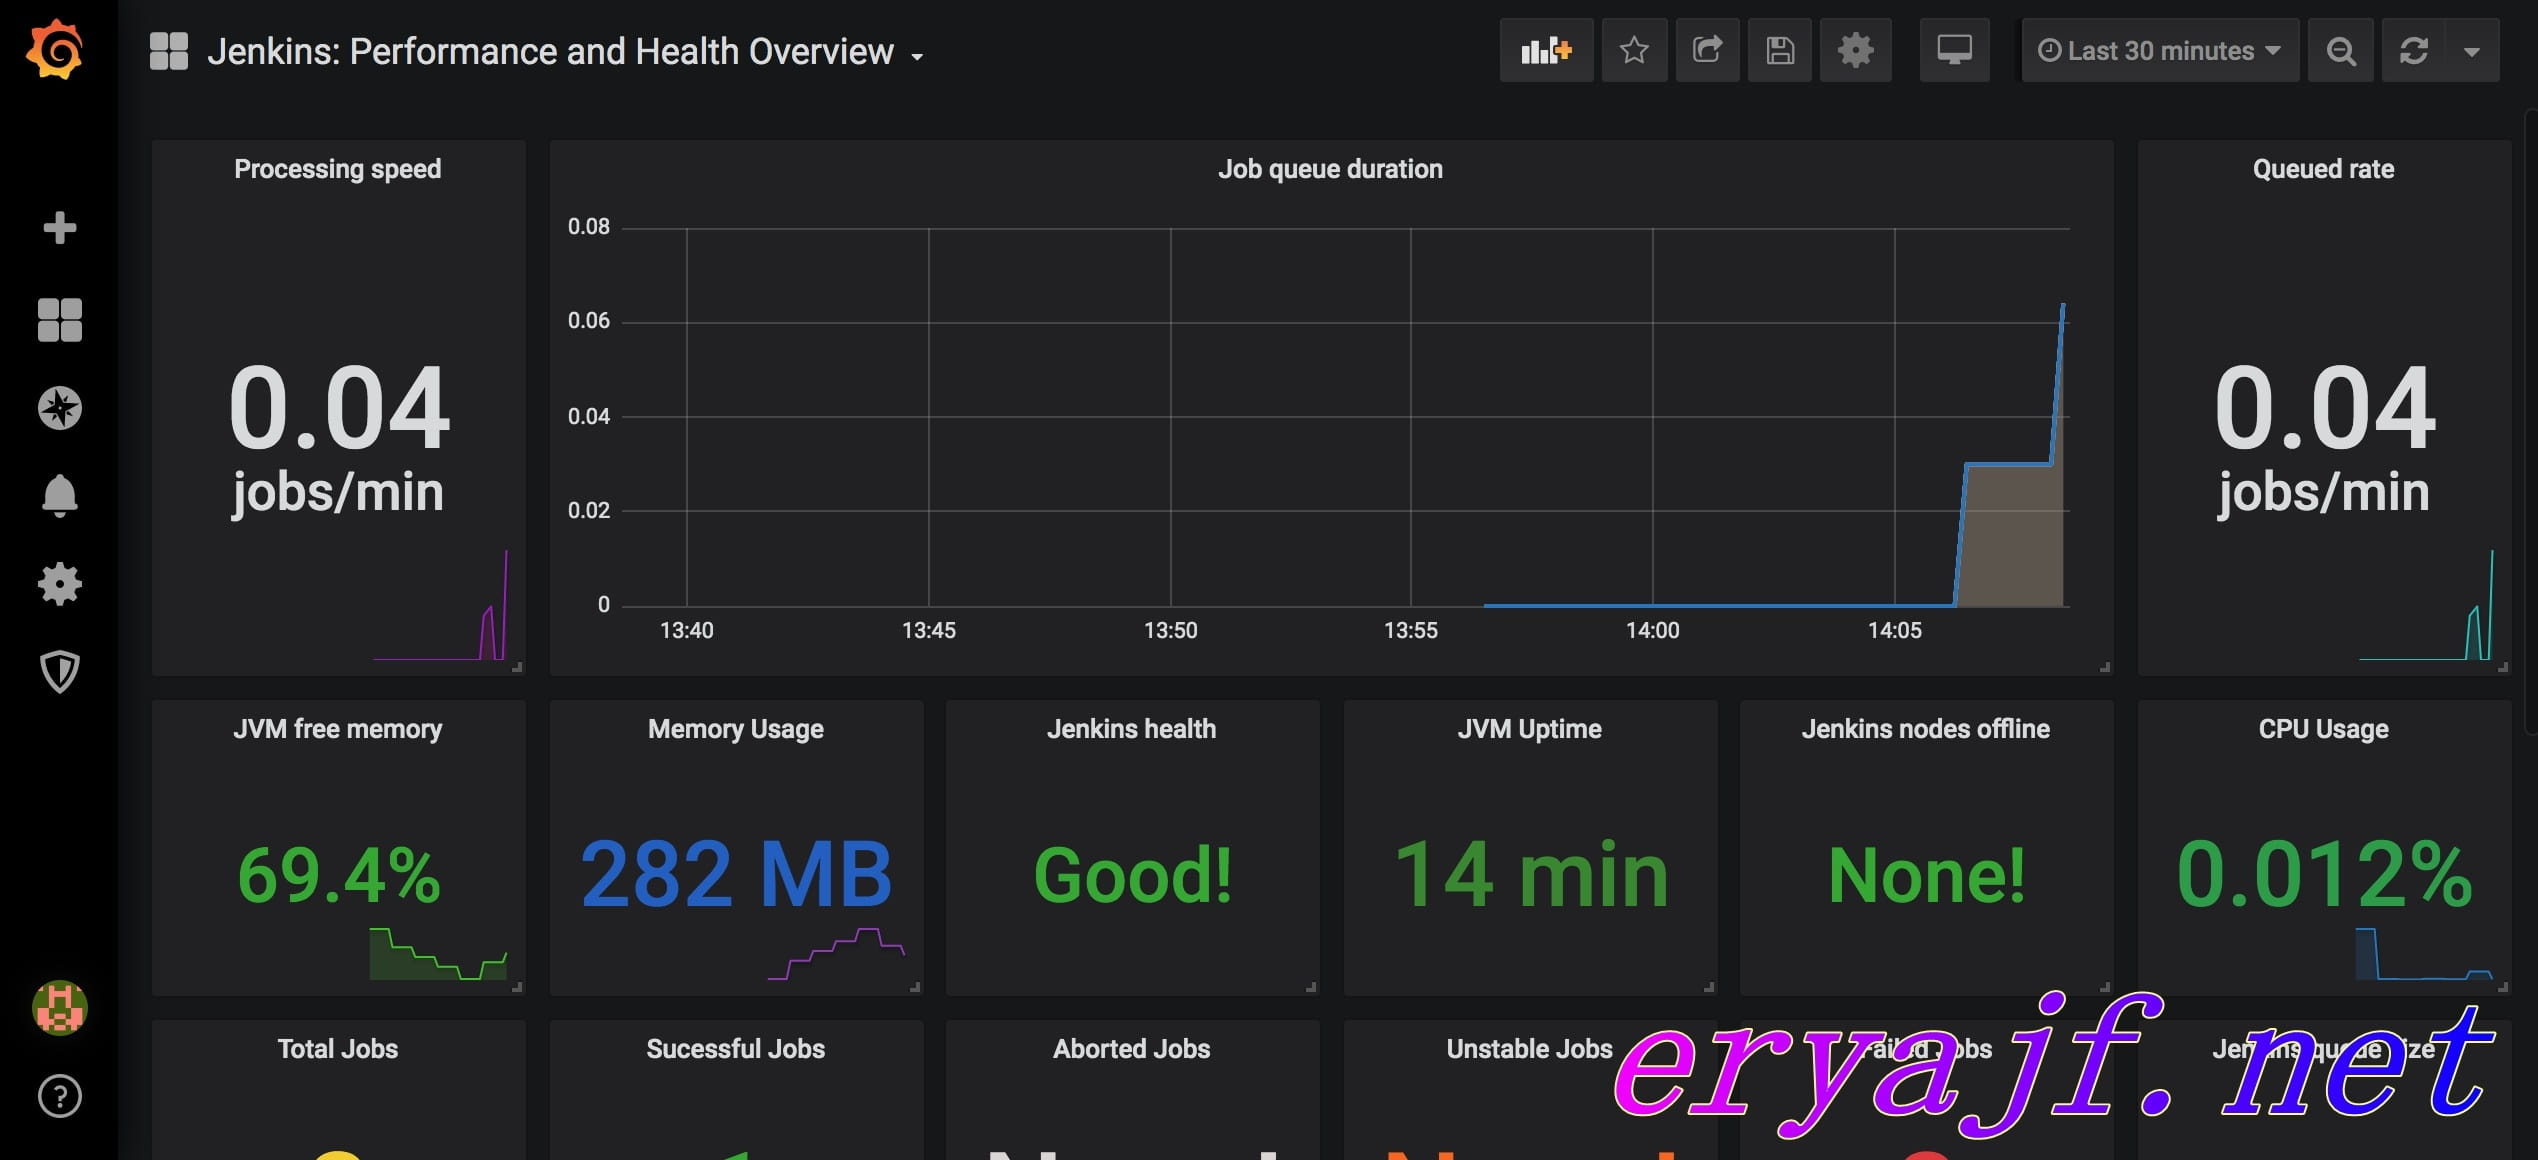
# 3,jenkins 监控 (opens new window)
# 4,其他工具
— 持续关注更新


上次更新: 2024/07/04, 22:40:37
 |
|