 手动搭建k8s-1-10-4集群插件之heapster
Heapster 是一个收集者,将每个 Node 上的 cAdvisor 的数据进行汇总,然后导到第三方工具 (如 InfluxDB)。
Heapster 是通过调用 kubelet 的 http API 来获取 cAdvisor 的 metrics 数据的。
由于 kublet 只在 10250 端口接收 https 请求,故需要修改 heapster 的 deployment 配置。同时,需要赋予 kube-system:heapster ServiceAccount 调用 kubelet API 的权限。
# 1,下载 heapster 文件
到 heapster release 页面 (opens new window) 下载最新版本的 heapster
wget https://github.com/kubernetes/heapster/archive/v1.5.3.tar.gz
tar -xzvf v1.5.3.tar.gz
mv v1.5.3.tar.gz heapster-1.5.3.tar.gz
2
3
官方文件目录: heapster-1.5.3/deploy/kube-config/influxdb
# 2,修改配置
$ cd heapster-1.5.3/deploy/kube-config/influxdb
$ cp grafana.yaml{,.orig}
$ diff grafana.yaml.orig grafana.yaml
16c16
<         image: gcr.io/google_containers/heapster-grafana-amd64:v4.4.3
---
>         image: cnych/heapster-grafana-amd64:v4.4.3
67c67
<   # type: NodePort
---
>   type: NodePort
2
3
4
5
6
7
8
9
10
11
修改后文件内容如下:
$ cat grafana.yaml

apiVersion: extensions/v1beta1
kind: Deployment
metadata:
  name: monitoring-grafana
  namespace: kube-system
spec:
  replicas: 1
  template:
    metadata:
      labels:
        task: monitoring
        k8s-app: grafana
    spec:
      containers:
      - name: grafana
        image: cnych/heapster-grafana-amd64:v4.4.3
        ports:
        - containerPort: 3000
          protocol: TCP
        volumeMounts:
        - mountPath: /etc/ssl/certs
          name: ca-certificates
          readOnly: true
        - mountPath: /var
          name: grafana-storage
        env:
        - name: INFLUXDB_HOST
          value: monitoring-influxdb
        - name: GF_SERVER_HTTP_PORT
          value: "3000"
          # The following env variables are required to make Grafana accessible via
          # the kubernetes api-server proxy. On production clusters, we recommend
          # removing these env variables, setup auth for grafana, and expose the grafana
          # service using a LoadBalancer or a public IP.
        - name: GF_AUTH_BASIC_ENABLED
          value: "false"
        - name: GF_AUTH_ANONYMOUS_ENABLED
          value: "true"
        - name: GF_AUTH_ANONYMOUS_ORG_ROLE
          value: Admin
        - name: GF_SERVER_ROOT_URL
          # If you're only using the API Server proxy, set this value instead:
          # value: /api/v1/namespaces/kube-system/services/monitoring-grafana/proxy
          value: /
      volumes:
      - name: ca-certificates
        hostPath:
          path: /etc/ssl/certs
      - name: grafana-storage
        emptyDir: {}
---
apiVersion: v1
kind: Service
metadata:
  labels:
    # For use as a Cluster add-on (https://github.com/kubernetes/kubernetes/tree/master/cluster/addons)
    # If you are NOT using this as an addon, you should comment out this line.
    kubernetes.io/cluster-service: 'true'
    kubernetes.io/name: monitoring-grafana
  name: monitoring-grafana
  namespace: kube-system
spec:
  # In a production setup, we recommend accessing Grafana through an external Loadbalancer
  # or through a public IP.
  # type: LoadBalancer
  # You could also use NodePort to expose the service at a randomly-generated port
  type: NodePort
  ports:
  - port: 80
    targetPort: 3000
  selector:
    k8s-app: grafana
2
3
4
5
6
7
8
9
10
11
12
13
14
15
16
17
18
19
20
21
22
23
24
25
26
27
28
29
30
31
32
33
34
35
36
37
38
39
40
41
42
43
44
45
46
47
48
49
50
51
52
53
54
55
56
57
58
59
60
61
62
63
64
65
66
67
68
69
70
71
72
73
74
- 镜像更改成自己已经 pull 好了的,并且开启 NodePort。
$ cp heapster.yaml{,.orig}
$diff heapster.yaml.orig heapster.yaml
23c23
<         image: gcr.io/google_containers/heapster-amd64:v1.5.3
---
>         image: cnych/heapster-amd64:v1.4.2
27c27
<         - --source=kubernetes:https://kubernetes.default
---
>         - --source=kubernetes:https://kubernetes.default?kubeletHttps=true&kubeletPort=10250
2
3
4
5
6
7
8
9
10
修改后文件内容如下:
$ cat heapster.yaml

apiVersion: v1
kind: ServiceAccount
metadata:
  name: heapster
  namespace: kube-system
---
apiVersion: extensions/v1beta1
kind: Deployment
metadata:
  name: heapster
  namespace: kube-system
spec:
  replicas: 1
  template:
    metadata:
      labels:
        task: monitoring
        k8s-app: heapster
    spec:
      serviceAccountName: heapster
      containers:
      - name: heapster
        image: cnych/heapster-amd64:v1.4.2
        imagePullPolicy: IfNotPresent
        command:
        - /heapster
        - --source=kubernetes:https://kubernetes.default?kubeletHttps=true&kubeletPort=10250
        - --sink=influxdb:http://monitoring-influxdb.kube-system.svc:8086
---
apiVersion: v1
kind: Service
metadata:
  labels:
    task: monitoring
    # For use as a Cluster add-on (https://github.com/kubernetes/kubernetes/tree/master/cluster/addons)
    # If you are NOT using this as an addon, you should comment out this line.
    kubernetes.io/cluster-service: 'true'
    kubernetes.io/name: Heapster
  name: heapster
  namespace: kube-system
spec:
  ports:
  - port: 80
    targetPort: 8082
  selector:
    k8s-app: heapster
2
3
4
5
6
7
8
9
10
11
12
13
14
15
16
17
18
19
20
21
22
23
24
25
26
27
28
29
30
31
32
33
34
35
36
37
38
39
40
41
42
43
44
45
46
47
48
- 由于 kubelet 只在 10250 监听 https 请求,故添加相关参数;
$ cp influxdb.yaml{,.orig}
$ diff influxdb.yaml.orig influxdb.yaml
16c16
<         image: gcr.io/google_containers/heapster-influxdb-amd64:v1.3.3
---
>         image: cnych/heapster-influxdb-amd64:v1.3.3
2
3
4
5
6
修改后文件内容如下:
$ cat influxdb.yaml

apiVersion: extensions/v1beta1
kind: Deployment
metadata:
  name: monitoring-influxdb
  namespace: kube-system
spec:
  replicas: 1
  template:
    metadata:
      labels:
        task: monitoring
        k8s-app: influxdb
    spec:
      containers:
      - name: influxdb
        image: cnych/heapster-influxdb-amd64:v1.3.3
        volumeMounts:
        - mountPath: /data
          name: influxdb-storage
      volumes:
      - name: influxdb-storage
        emptyDir: {}
---
apiVersion: v1
kind: Service
metadata:
  labels:
    task: monitoring
    # For use as a Cluster add-on (https://github.com/kubernetes/kubernetes/tree/master/cluster/addons)
    # If you are NOT using this as an addon, you should comment out this line.
    kubernetes.io/cluster-service: 'true'
    kubernetes.io/name: monitoring-influxdb
  name: monitoring-influxdb
  namespace: kube-system
spec:
  ports:
  - port: 8086
    targetPort: 8086
  selector:
    k8s-app: influxdb
2
3
4
5
6
7
8
9
10
11
12
13
14
15
16
17
18
19
20
21
22
23
24
25
26
27
28
29
30
31
32
33
34
35
36
37
38
39
40
41
42
# 3,执行所有定义文件
修改后的文件内容如下:
$ cat heapster-rbac.yaml

kind: ClusterRoleBinding
apiVersion: rbac.authorization.k8s.io/v1beta1
metadata:
  name: heapster
roleRef:
  apiGroup: rbac.authorization.k8s.io
  kind: ClusterRole
  name: system:heapster
subjects:
- kind: ServiceAccount
  name: heapster
  namespace: kube-system

---
kind: ClusterRoleBinding
apiVersion: rbac.authorization.k8s.io/v1beta1
metadata:
  name: heapster-kubelet-api
roleRef:
  apiGroup: rbac.authorization.k8s.io
  kind: ClusterRole
  name: system:kubelet-api-admin
subjects:
- kind: ServiceAccount
  name: heapster
  namespace: kube-system
2
3
4
5
6
7
8
9
10
11
12
13
14
15
16
17
18
19
20
21
22
23
24
25
26
27
28
- 将 serviceAccount kube-system:heapster 与 ClusterRole system:kubelet-api-admin 绑定,授予它调用 kubelet API 的权限;
# 4,检查执行结果
检查 kubernets dashboard 界面,可以正确显示各 Nodes、Pods 的 CPU、内存、负载等统计数据和图表:

# 5,访问 grafana
# 1. 通过 kube-apiserver 访问
获取 monitoring-grafana 服务 URL:
浏览器访问 URL: https://192.168.106.110:8443/api/v1/namespaces/kube-system/services/monitoring-grafana/proxy
# 2,通过 kubectl proxy 访问:
创建代理
kubectl proxy --address='192.168.106.5' --port=8086 --accept-hosts='^*$'
Starting to serve on 192.168.106.5:8086
2
浏览器访问 URL:http://192.168.106.5:8086/api/v1/namespaces/kube-system/services/monitoring-grafana/proxy/?orgId=1
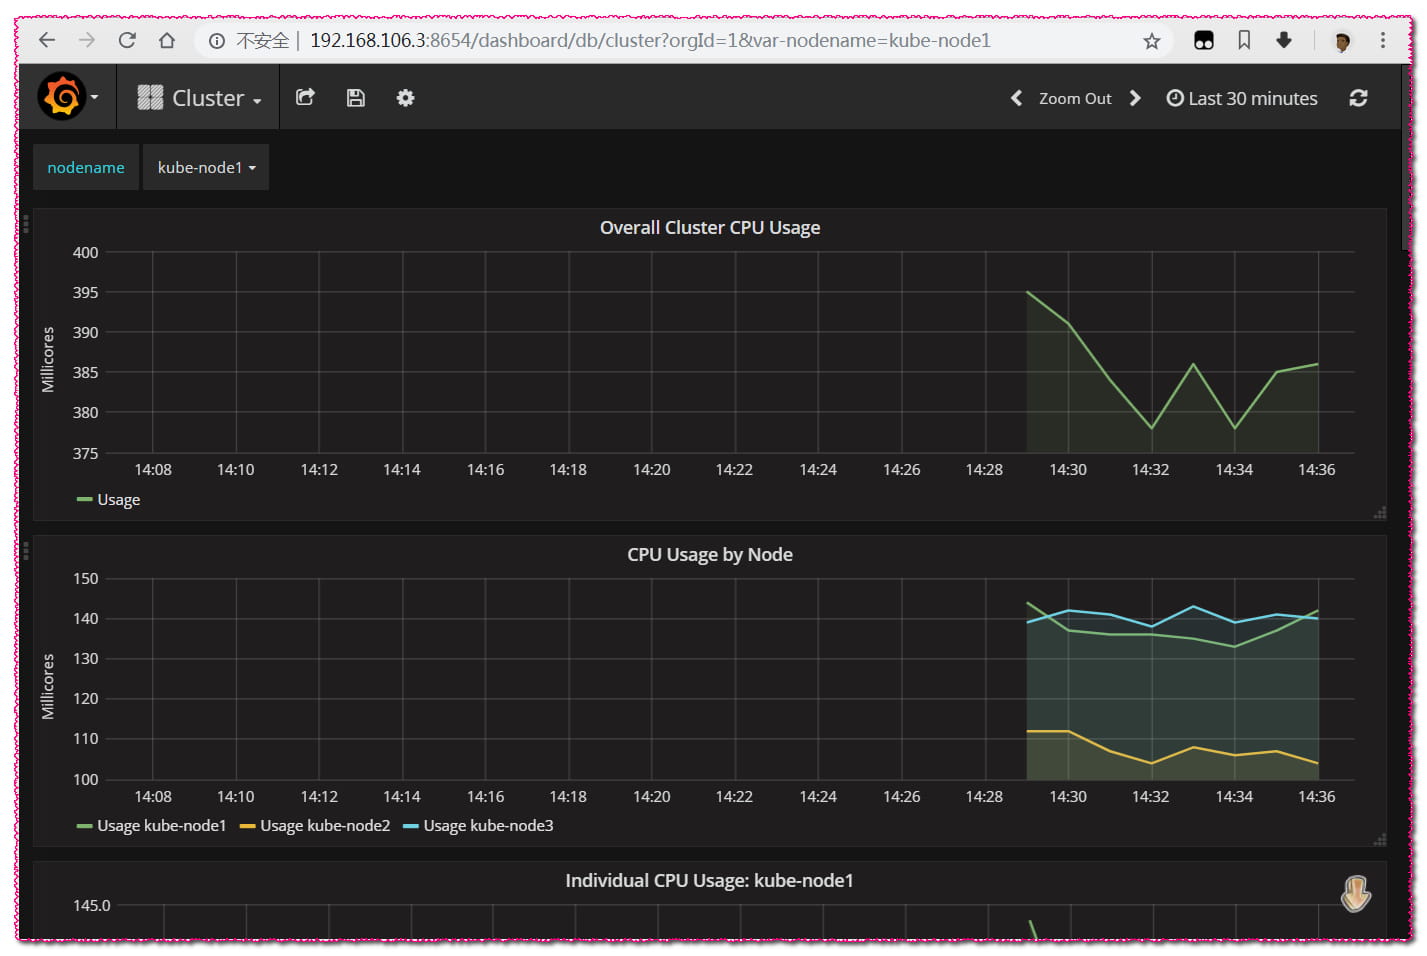
# 3,通过 NodePort 访问:
$ kubectl get svc -n kube-system|grep -E 'monitoring|heapster'
heapster               ClusterIP   10.254.34.87    <none>        80/TCP          12m
monitoring-grafana     NodePort    10.254.186.62   <none>        80:8654/TCP     12m
monitoring-influxdb    ClusterIP   10.254.55.105   <none>        8086/TCP        12m
2
3
4
- grafana 监听 NodePort 8654;
浏览器访问 URL:http://192.168.106.3:8654/?orgId=1
那么,这个时候,可以通过如下几种方式访问到 grafana 服务:
- http://192.168.106.3:8654/?orgId=1
- http://192.168.106.4:8654/?orgId=1
- http://192.168.106.5:8654/?orgId=1
- https://192.168.106.110:8443/api/v1/namespaces/kube-system/services/monitoring-grafana/proxy
进去之后可以点击一下集群,看看里边的一些信息:
# 6,参考:
- 配置 heapster:https://github.com/kubernetes/heapster/blob/master/docs/source-configuration.md


 |
|